
You are here
Historical Maps
Through our research that led to the writing the book, our Harvard Forest group has compiled a large collection of digitized maps of the Vineyard from the 16th – 21st century.
There are many sources of historical maps where one can spend days exploring the changing nature of the land and waters of the Vineyard and beyond. While the Martha’s Vineyard Museum has a wonderful collection that is readily accessible to visitors on Tuesday and Thursday afternoons in Edgartown, a number of major repositories offer fabulous opportunities for the digital exploration of their archives. These include the Norman B. Leventhal Map Center at the Boston Public Library, the Library of Congress, and the National Oceanographic and Atmospheric Administration. The latter has done a nice job of digitizing the many products of the U.S. Coastal Survey, which produced many detailed maps and charts of the Vineyard beginning in the mid-nineteenth century. These include one that we developed into a full-size map and web-viewer of the Island in 1850.
We are always searching for additional resources concerning the Vineyard. We would welcome any information on maps that add to the collection that we present here.
It would be most useful to receive internet links to maps that are held by established archives. However, we would be delighted to receive information concerning any other maps, published or unpublished, that provide insights into the Vineyard’s history and present.
Useful Resources for map discovery
- Norman B. Lenventhal Map Center at the Boston Public Library
- Library of Congress
- NOAA - Office of the Coast Survey
- NOAA - Historical Map & Chart Collection
- Gale Huntington Research Library at the Martha's Vineyard Museum
- Map Collection Index at the Martha's Vineyard Museum
- Digital Commonwealth
Historical Maps
| Map (click for full size image) | Description of Map |
|---|---|
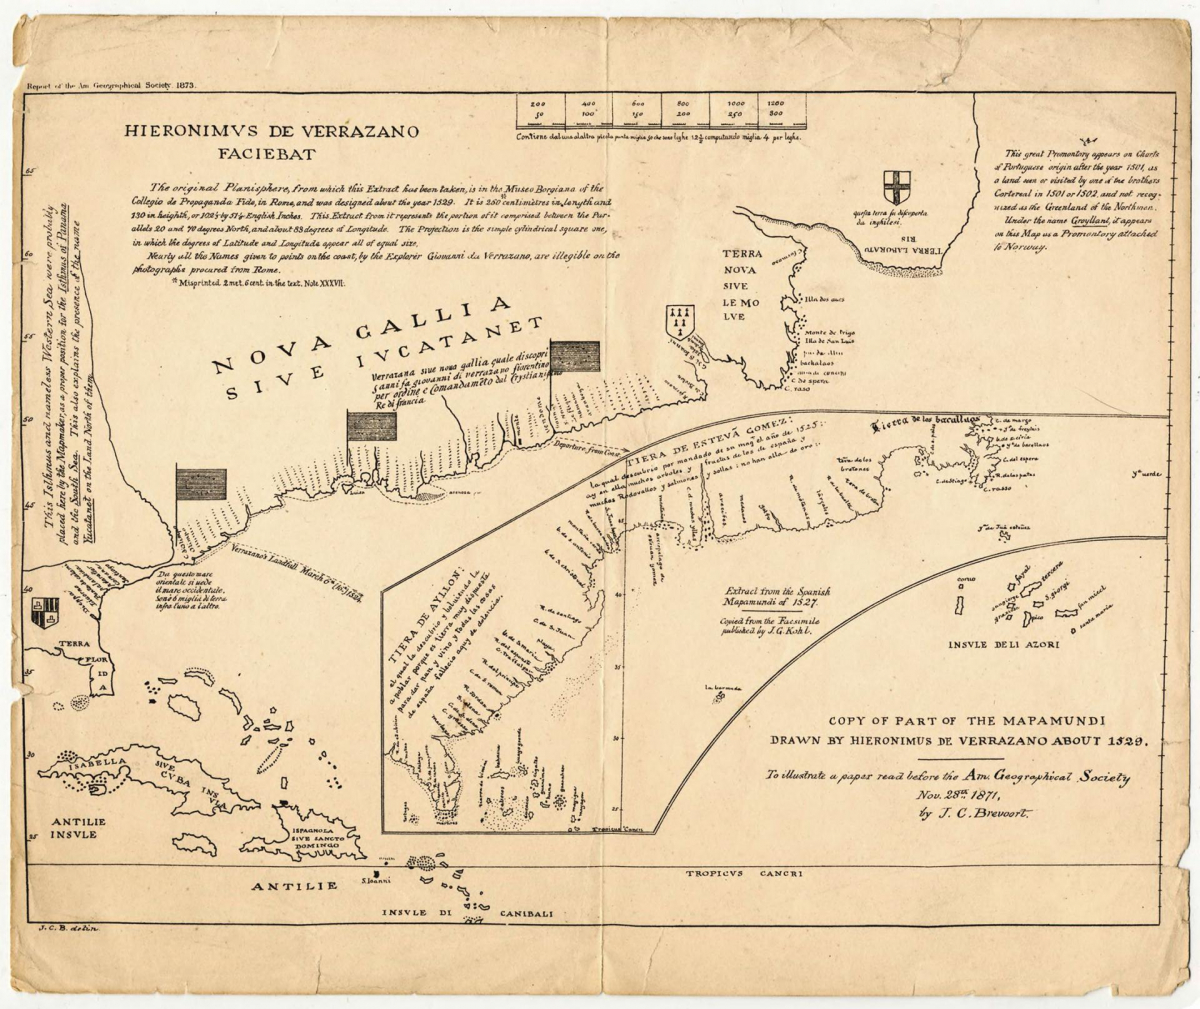 | 1529 Verrazzano. World Map (detail)The following description comes from NYC 999. An Historical Atlas of New York City. The original map from the Secretary of State, Washington State This facsimile is from Paullin’s 1932 Atlas of the Historical Geography of the United States. The chart, which significantly skews longitude (the fundamental problem with navigation until the 19th century), shows Verrazzano’s [note that the man’s name is spelled differently than the bridge] discoveries on the Atlantic Coast with New York Bay named “Angouleme” (Francis I was known as Francis of Angouleme before becoming king), Long Island “Flora,” and Block Island “Louisa.” |
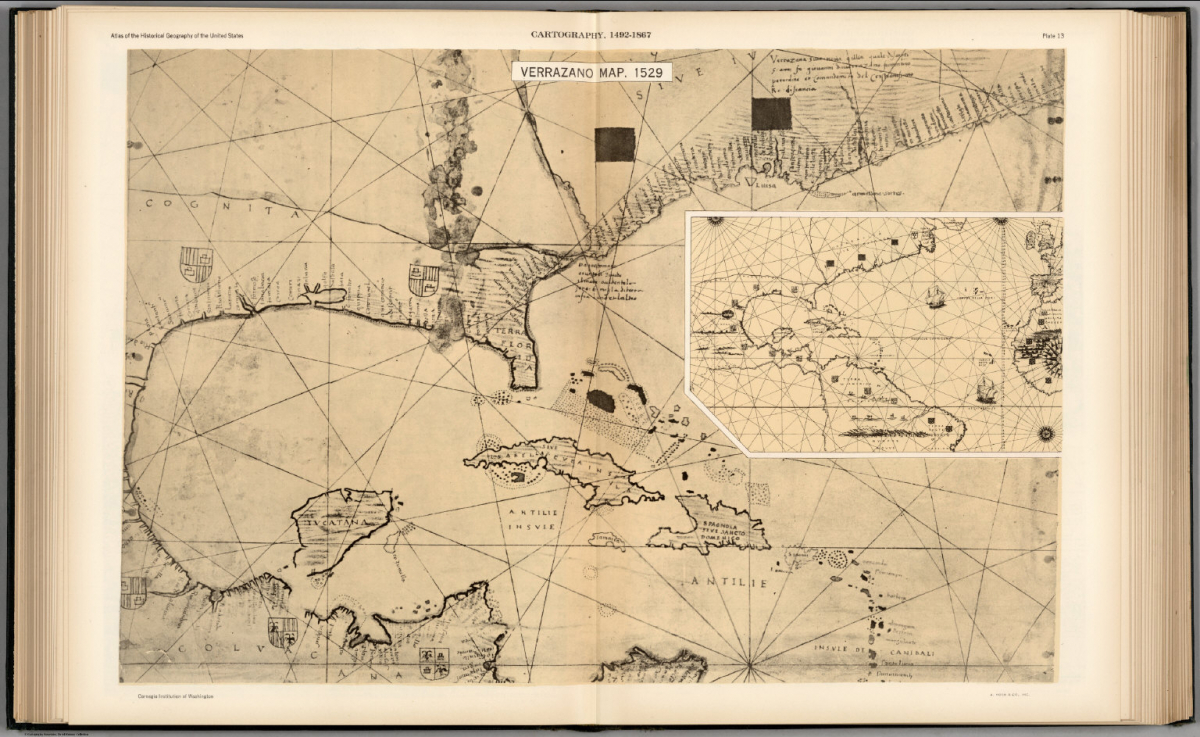 | 1529 Verrazzano. World Map (detail)Description the same as above. |
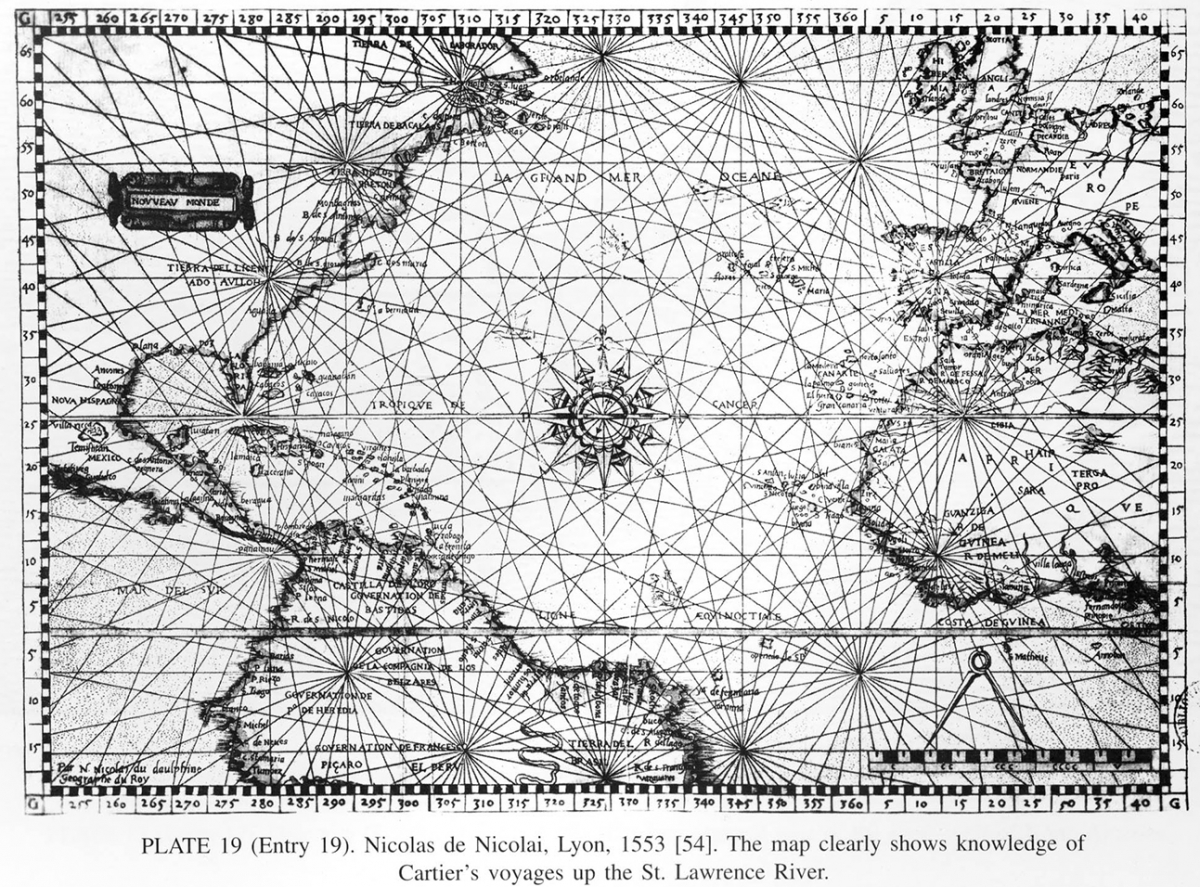 | 1553 Nicolas De Nicolai. The New WorldThe following description and original map comes from Barry Lawrence Ruderman Antique Maps. A rare early map of the New World and the Atlantic, engraved by Nicolas de Nicolai, the French Royal Geographer in the mid-16th Century. De Nicolai's map is one of the earliest maps of America to accurately report a number of the earliest contemporary discoveries. It is also the earliest map of America published in France. De Nicolai's map is a tremendous improvement over the crude American map which appeared in the 1548 Valladolid/Seville edition of Medina's Arte de Navegare. De Nicolai's map is substantially enlarged and printed with a copper plate. The map shows knowledge of Cartier's voyages up the St. Lawrence and many more islands in the Gulf. Along the eastern seaboard, the name C. des maria represents the Outer Banks of the Carolinas, the earliest reference to this region. Tierra Del Licenado Avolloh refers to the unsuccessful attempt at a colony by Spanish Conquistador Lucas Vasquez de Ayllon in South Carolina. The Bahamas are shown, as is Bermuda, and Cuba. The Yucatan is an Island. Florida is named, as is C. Berton (Breton), Tierra de los Bretons, Jamaica, the Virgin Islands, Hispaniola, Mexico City etc. The Amazon is shown flowing North & South. The mythical Island of Brasil is shown. |
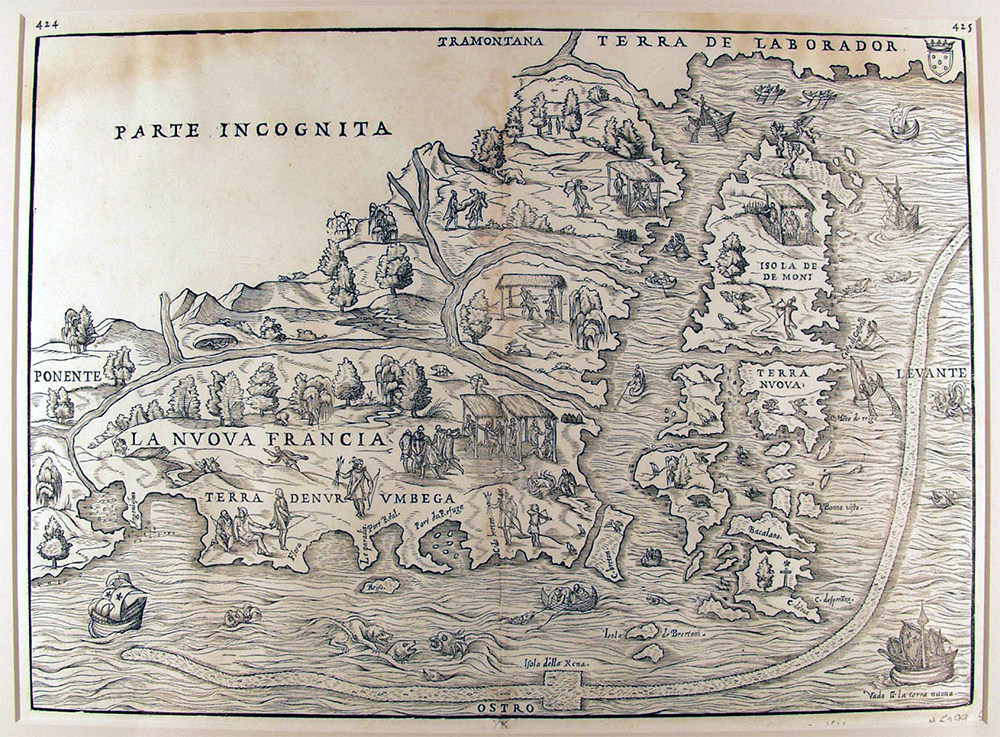 | 1556 Di Gastaldi. New FranceThe following description comes from the Library of Stony Brook University. Gastaldi’s map of New France is the earliest printed map focusing on what is now northeastern Canada and the United States. Published in the third volume of J.B. Ramusio's Viagi (Voyages), it is largely based on the voyages of Cartier and Verrazano. The Hudson River, the St. Lawrence River, and the islands near the Gulf of St. Lawrence are the most prominent features on this map. A curious snake-like projection in the Atlantic Ocean has been the subject of much speculation. It is probably an attempt to depict the Grand Banks. An “Island of Sand” (Isola della Rena) is part of this feature--possibly it is Sable Island. The depiction of the area between New York Harbor and Narragansett Bay is based on the voyage of Verrazano in 1524. The area around New York Harbor is named Angoulesme. The large bay to the east of New York Harbor is probably Jamaica Bay, which was more open to the ocean at that time. Long Island, which Verrazano thought was a peninsula, is labeled Flora. Newport Bay is Port Real on the map, and Narragansett Bay is Port du Refuge. Block Island appears as Brisa. Note that the Hudson River is shown joining the St Lawrence. This curious feature may derive from the use of information gathered from Native American informants. Some early maps drawn by American Indians show canoe routes, and do not distinguish between waterways and portages. |
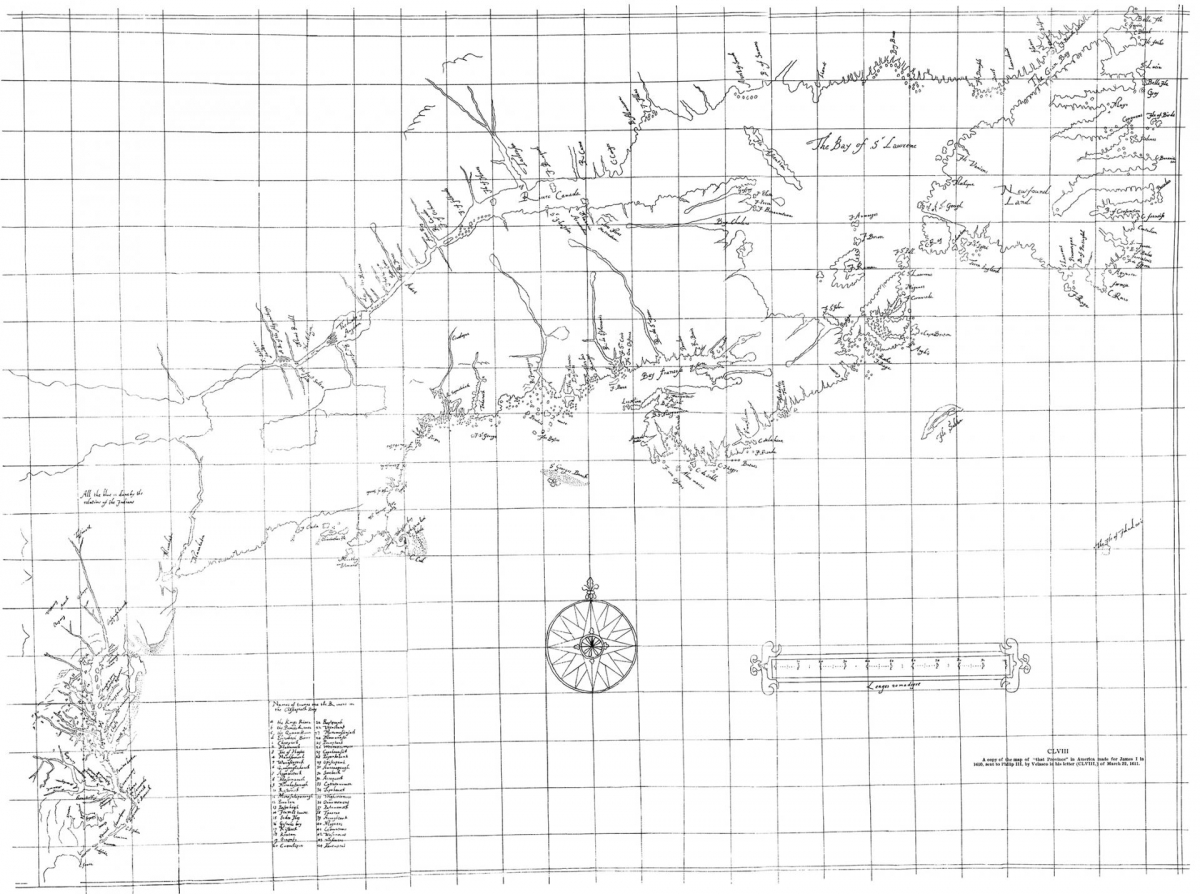 | 1610 Simancas. Northeastern Coast.Also called The Velasco Map. An incredibly detailed early map that has alternatively been extolled by many scholars and described as a forgery in an article below by David Allen at Stony Brook University. The following comes from Stokes, I. N. Phelps. The Iconography of Manhattan Island, 1498–1909. New York: Robert Dodd, 1915–1928. (6 vol) The Velasco Map: v2, pl. 22; 67–68 On 22 March 1611 Don Alonso de Velasco, the Spanish ambassador to England, sent a letter written in cipher with intelligence on English activities in Virginia to King Philip III of Spain. Enclosed with the letter was a pirated four-sheet manuscript “plan or map of that Province” reportedly made by an English surveyor in 1610 and drawn by an anonymous English cartographer. The Velasco map ended up in the General Archive of Simancas, where it remained forgotten until it was rediscovered by the historian Alexander Brown in 1887. The map, a composite of not only English, but French and Dutch information, shows the discoveries of Hudson between Newfoundland and Virginia with close fidelity to Juet’s journals. It is the first map to show the (relatively) accurate course of the Hudson River, which is labelled with the Lanape names “Manahata” and “Manahatin.” The map is “Drawn in colors on four sheets of paper pasted together and is 81 by 111 centimeters. Overall the map presents a remarkably accurate outline of North America. Perhaps too remarkable; as Samuel Adams Drake stated in 1892, “it is entirely too good for the state of discovery at that early period of the seventeenth century.” Early historians, such as Brown or Stokes thought the map to be authentic but current researchers are much more critical, considering it an expert forgery.5 Nevertheless, it remains the only early map of Hudson’s journeys. The So-Called “Velasco Map”: A Case of Forgery?David Allen, Stony Brook University This article examines a well-known map of the northeastern United States and southeastern Canada allegedly made in or around 1610. The map was uncovered in the Spanish Archives at Simancas in 1887. Supposedly, it is a copy of an anonymous English map, which was sent to King Phillip III of Spain by the Spanish ambassador to London, Don Alonzo de Velasco. This article raises the possibility that the map may actually be a nineteenth-century forgery. The map is based primarily on information found on early seventeenth-century maps, most of which were not published in 1610, although it is possible that manuscript copies of these maps might have been available as early as 1610. The overall geographic framework of the map seems to be improbably accurate for its supposed date of creation. The map contains numerous oddities, and many features on the map do not appear on other maps made in the early seventeenth century. Overall it seems anachronistic and it stands in isolation from other maps made around 1600. Although no single feature on the map proves beyond a doubt that it is a forgery, the overall weight of the evidence makes it seem highly probable that it is a fake. Tests on the paper, pigment, and handwriting of the map should be made to prove conclusively whether or not it is a forgery. |
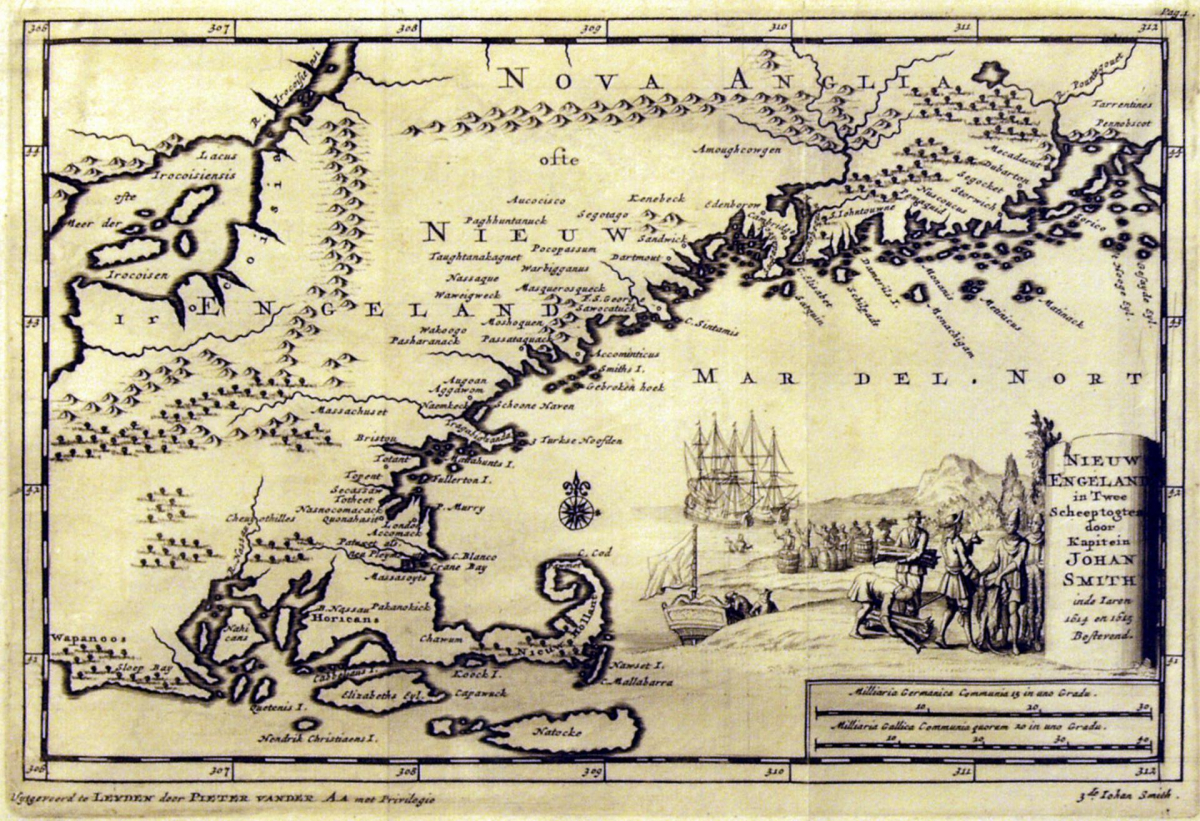 | 1615 John Smith. New England.From the New Netherlands Institute Nieuw Engeland in Twee Scheeptogen door Kapitein Johan Smith inde iaren 1614 en 1615 bestevend. (New England as Described by Captain John Smith in two voyages in 1614 and 1615.) This version of the map itself was created 1714. Mapmakers: Peter van der Aa and John Smith Published in van der Aa's Atlas nouveau et curieux, Leyden, 1714. The map lacks many details but has a beautiful illustration of Dutchmen trading with the Native Americans. |
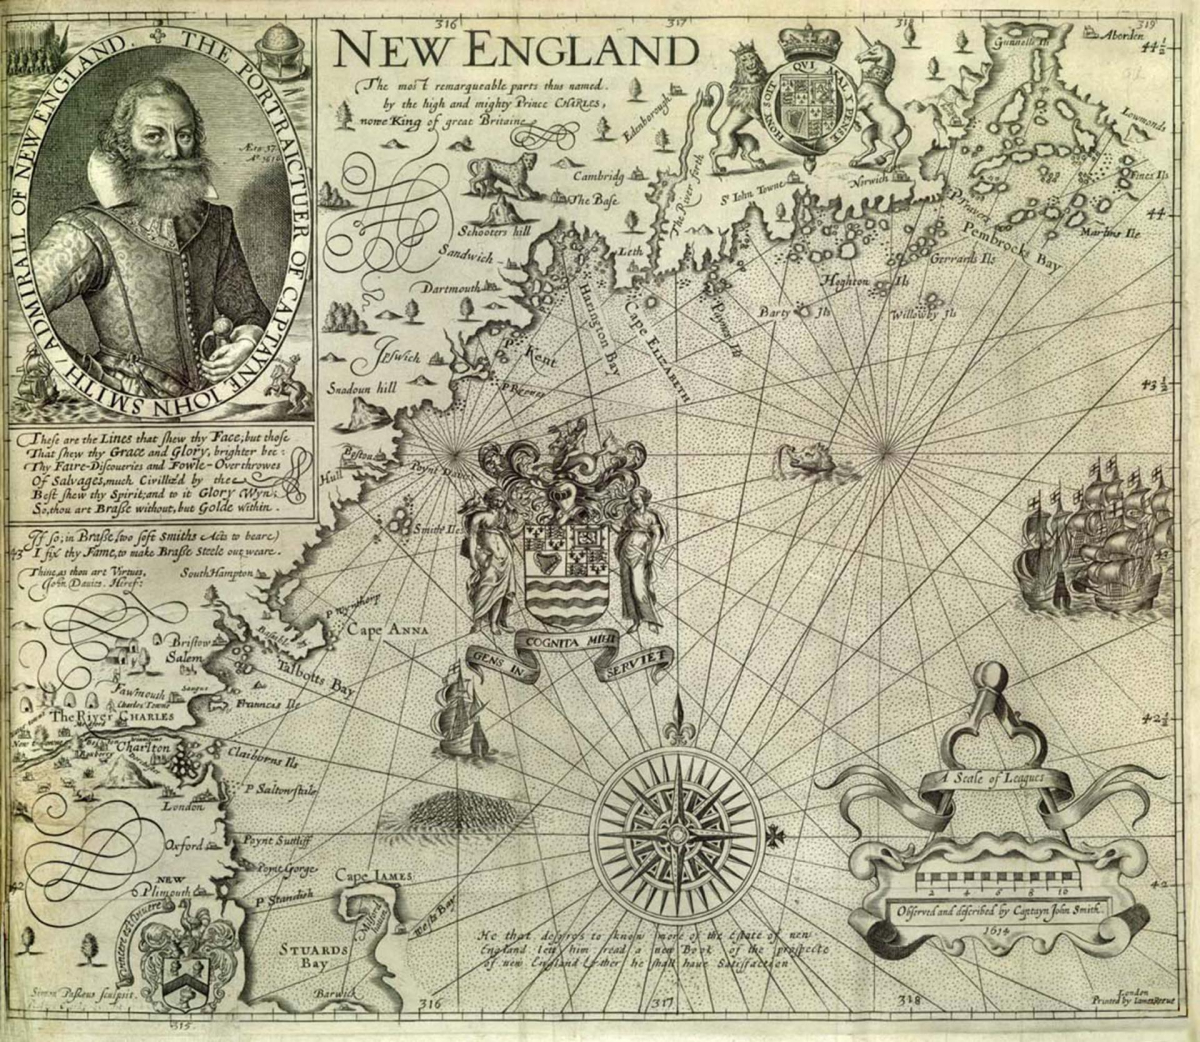 | 1616 John Smith. New England.From the Osher Map Library at the University of Southern Maine. The first map to name the region of "New England" was published by John Smith in 1616, in an effort to promote colonization. Smith asked Prince Charles--later, Charles I--to replace the indigenous place-names with properly "English" ones. This apparently imperialist act in fact constituted only a symbolic event. Subsequent settlement by English colonists--the Pilgrims landed in 1620--was focused along the Charles River and led to several settlements; these can be seen in the 1635 version of Smith's map. Only three names from Smith's map survived through use by the settlers: Cape Ann; Charles River; and, Plymouth. Otherwise, the European settlers imposed their own names or adapted indigenous names. |
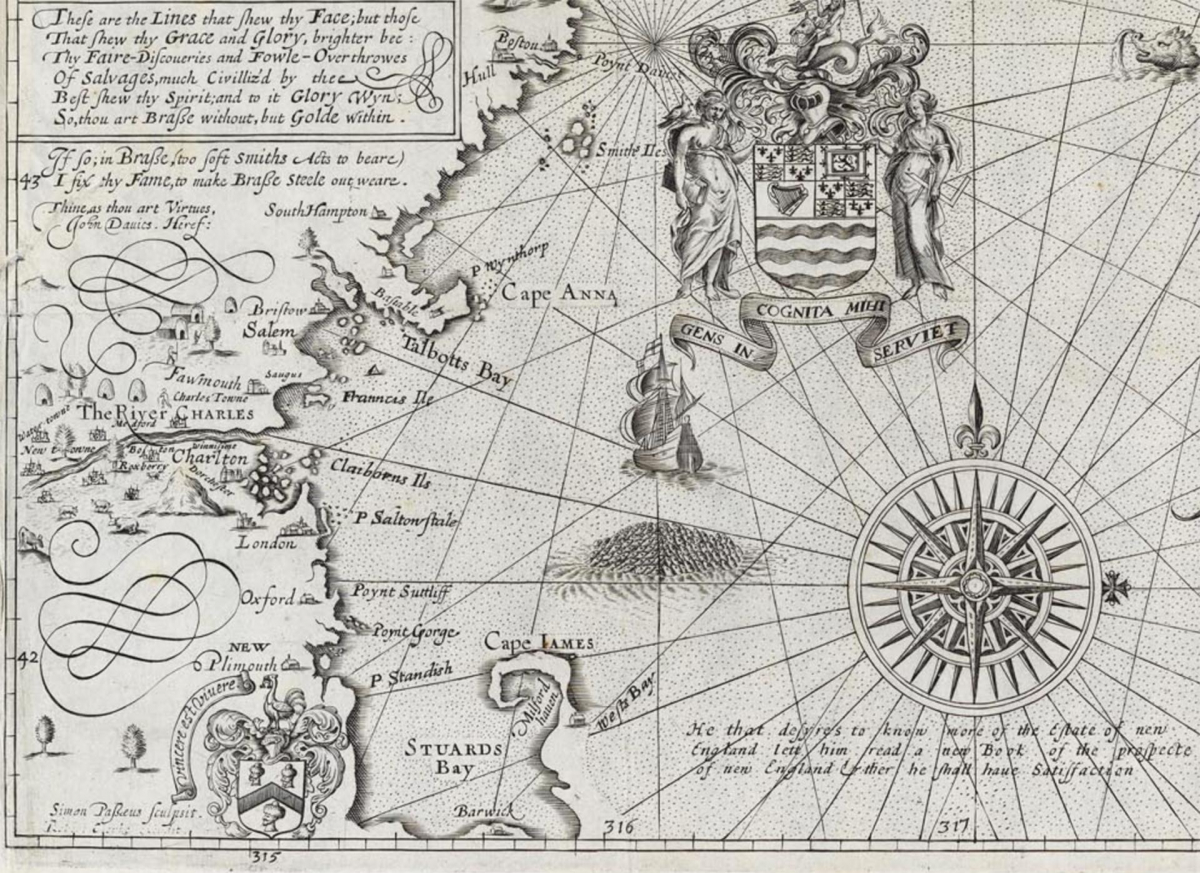 | 1616 John Smith. New England (Detail).From the Osher Map Library at the University of Southern Maine. Description the same as above. |
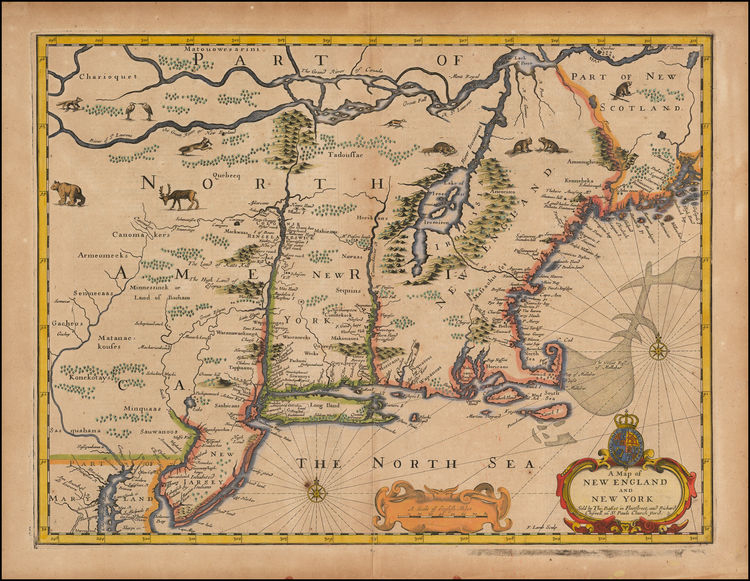 | 1676 John Speed. New England and New York.From Barry Lawrence Ruderman Antique Maps Decorative example of John Speed's map of the Northeast, from the 1676 edition of Speed's Prospect of the World. Speed's map is one of the earliest maps to illustrate dramatic shift from Dutch to English dominance in the Northeast in the latter part of the 17th Century and one of the earliest to use the term New York for both Manhattan (formerly New Amsterdam) and New York State, as well as one of the earliest appearances of New Iarsey (Jersey). As noted by Michael Buehler, Speed's map shares the traits of many other regional maps of the period: a haphazard depiction of the St. Lawrence, no sign of Lake Ontario, Lake Champlain offset far to the East of its actual location, Cape Cod at essentially the same latitude as New York City, and the Delaware River curving eastward to connect with the Hudson. Many of these errors can be traced far back to early 17th-century prototype maps by Samuel Champlain, Adrien Block and others. One of only a small group of English maps of New England, prior to 1700. Based on Jansson's map of 1651, it illustrates the territories acquired by the British with the capture of New Amsterdam in 1664, which radically adjusted the landscape of North American politics. While the map's geographical features are largely drawn from Jansson, the map's nomenclature is substantially anglicized, including the first appearance of name Boston (omitted from the Jansson maps), and the use of the names New York and Cape Cod. The map is richly embellished with various animals in the interior of the map, two compass roses, two cartouches and a coat of arms. Engraved by Francis Lamb after Speed's death, the map appeared in the 1676 edition of Speed's Prospect of the Most Famous Parts of the World. |
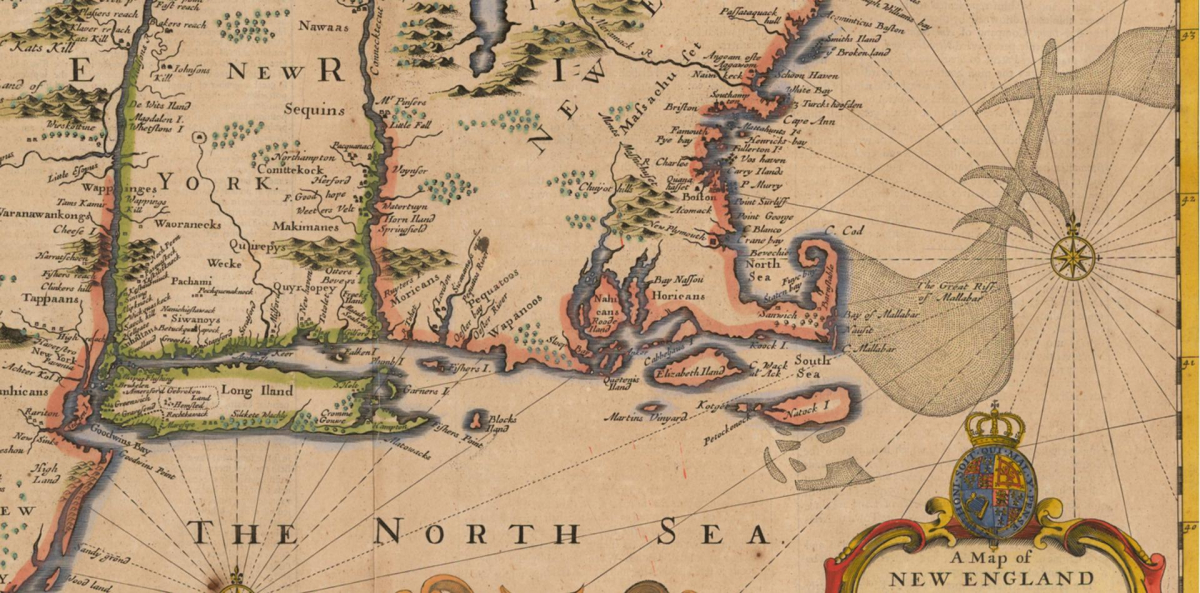 | 1676 John Speed. New England and New York (Detail).From Barry Lawrence Ruderman Antique Maps Description the same as above. |
 | 1698 Simon Athearn. "Original" version of his annotated map of Martha's Vineyard.The “original” is a poor photograph taken from a display on the Manuel F. Correllus State Forest, which is copied or based on a map at the Martha’s Vineyard Museum. |
 | 1698 Simon Athearn. Transcribed version of his annotated map of Martha's Vineyard.The peculiar transcribed version of Athearn’s map comes from the Indian Converts Collection at the Reed College Digital Collection. The original map is at the Martha’s Vineyard Museum. |
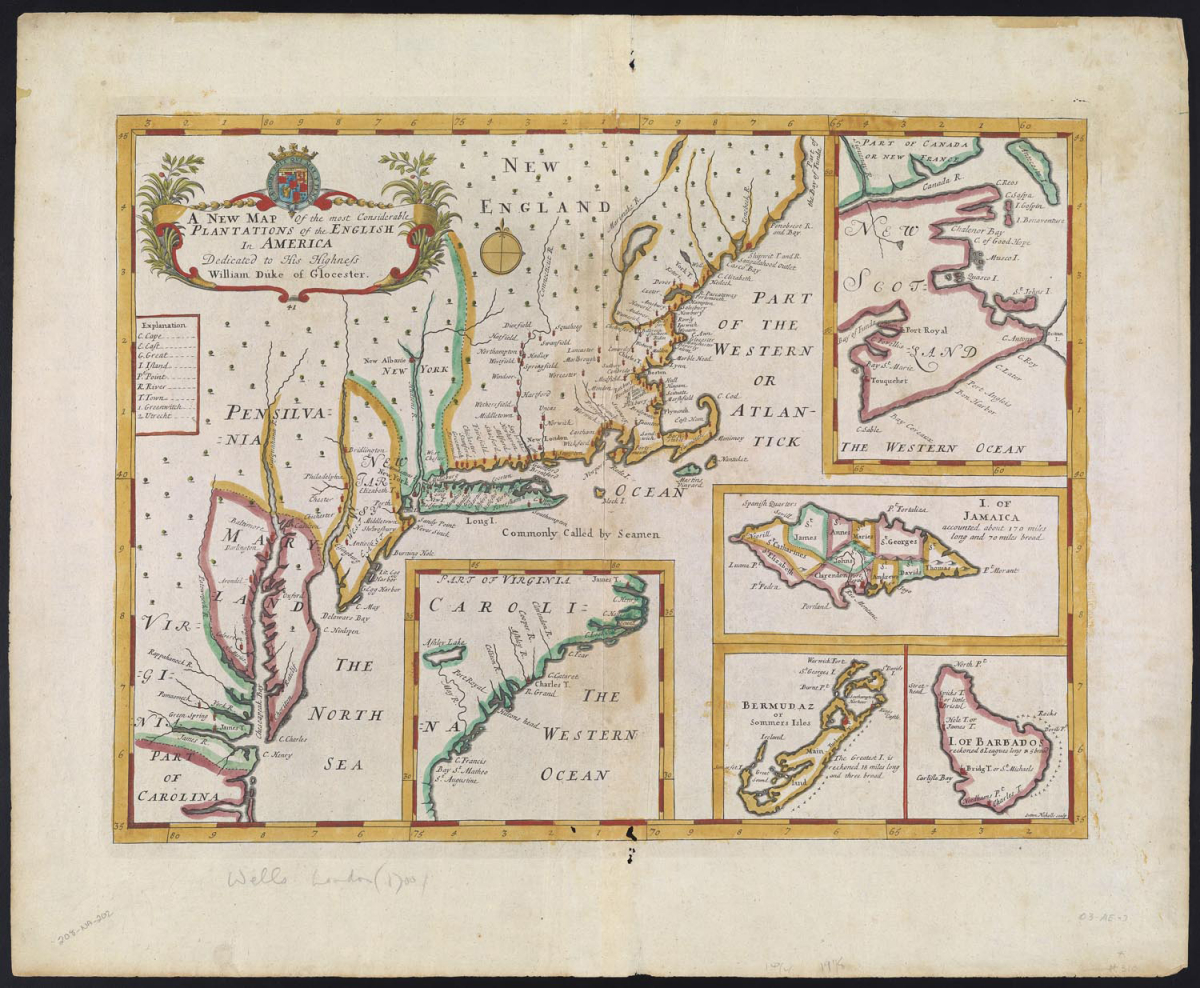 | 1700 Wells. A New Map of the Most Considerable Plantations of the English In America.From the Osher Map Library at the University of Southern Maine. English settlement in the region remained quite scattered until 1700. Wells's map of that date places the region into the context of all of the English plantations in North America. In this respect, New England can be understood as comprising the area of English settlement east of the former Dutch colony of New Netherlands (New York). Edward Wells. |
 | 1700 Wells. A New Map of the Most Considerable Plantations of the English In America (Detail).From the Osher Map Library at the University of Southern Maine. Description the same as above. |
 | 1725–1735 Subdivision of Homes Hole Neck.One of a couple of maps depicting the manner in which West Chop, or Homes Hole Neck, was subdivided among various members of the Chase family in the period before the Revolutionary War. This family hold over the entire West Chop region was important for it precluded the further sale and partitioning of the land among other families that may have settled, cleared and farmed the land as was done with East Chop and other lands in Tisbury. As a consequence, the bulk of West Chop, other than a coastal fringe, remained entirely forested well into the twentieth century. A coarse version of this map is included in Banks’ History of Martha’s Vineyard. This finely partitioned map comes from Jim Norton who compiled the information from deed records and presented the map in his Walking in Vineyard Haven book. |
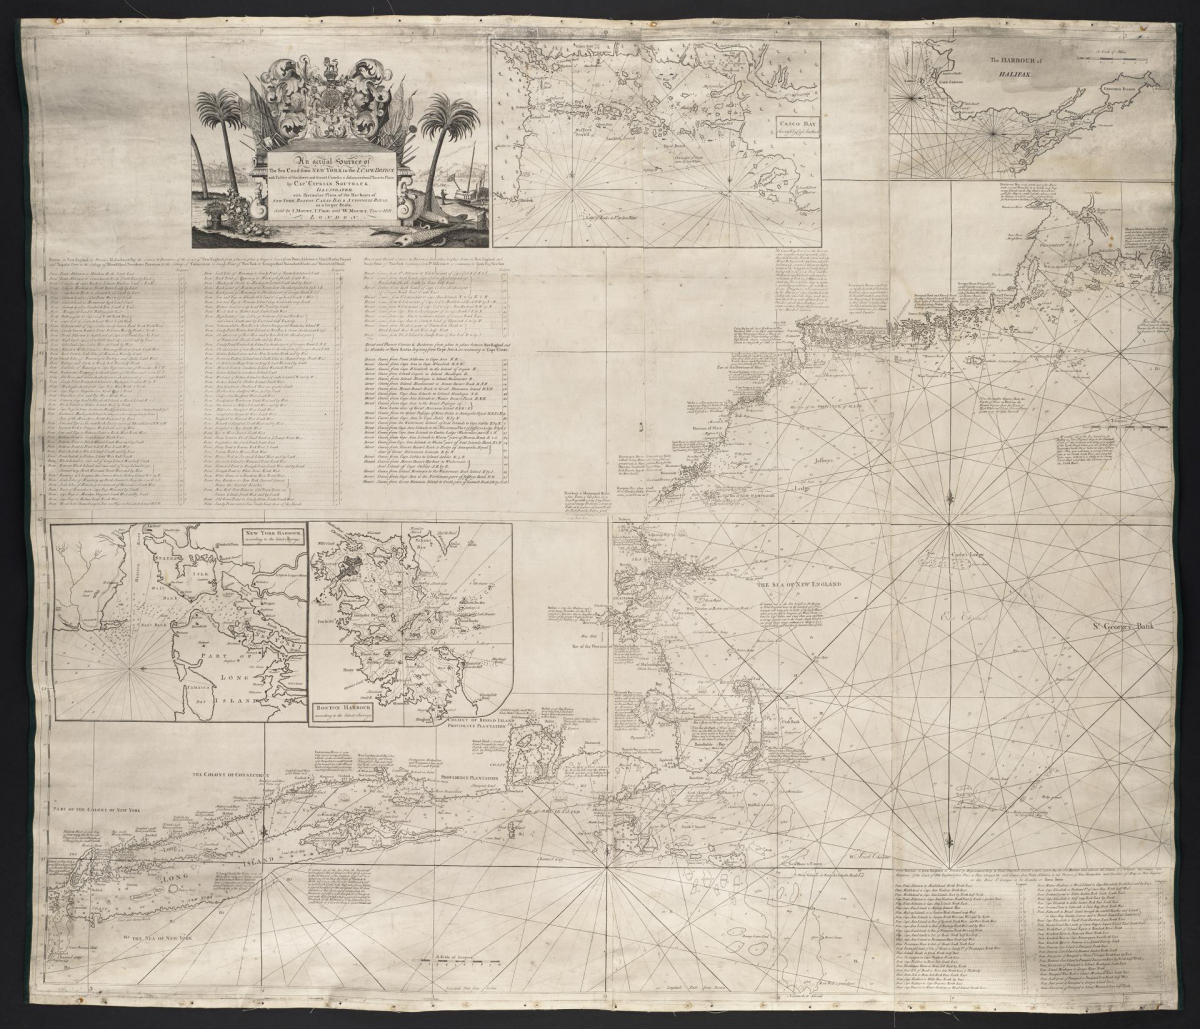 | 1735 Southack. The Sea Coast from New York to Cape Breton.An early and very detailed map of a large coastal region showing fairly good portrayal of Cape Cod, Martha’s Vineyard, Nantucket and the Elizabeth Islands. Depicts Chappaquiddick as “Indian Town” and as separate from Martha’s Vineyard. A number of excellent versions of this map are available at the Boston Public Library. One is provided here along with a reproduction from Wigglesworth’s thesis. Below, by Clara Egli LeGear, John Nickelis, and George Martin. 1954. The New England Coasting Pilot of Cyprian Southack. Imago Mundi 11: 137-144. One of the cartographical rarities of colonial America is a pilot guide of the northeast coast, of which only three copies are known. It bears the lengthy and descriptive title of The New England Coasting Pilot from Sandy Point of New York, unto Cape Canso in Nova Scotia, and Part of Island Breton. With the Courses and Distances from Place to Place, and towns on the Sea-Board; Harbours, Bays, Islands, Roads, Rocks, Sands: The Setting and Flowing of tides and Currents; with several other Directions of great Advantage to this Part of Navigation in North-America. By Capt. Cyprian Southack, who has been Cruizing in the Service of the Crown of Great Britain Twenty-two years. Southack, who was for seventeen years captain of the Massachusetts Province Galley, often supplied information to his fellow captains for bringing their vessels safely into port. As sailing charts were inadequate and harbor charts non-existent, Southack undertook the task of preparing some of these essential aids to navigation. He is known to have prepared upward of twenty maps. His most ambitious undertaking was The New England Coasting Pilot. The eight maps in the Coasting Pilot contain a wealth of information gathered by Southack as he sailed up and down the coast. There are over 100 descriptive notes on the places named, the longest of which accompanies the inset of Louisburg Harbor on the last map. Some of the notes mention Southack's participation in the several English expeditions against the French in Nova Scotia and Cape Breton. Others reflect his interest in safe harbors, navigational hazards, water depths, tides and currents, as well as natural resources, potential industries, fishing grounds, fish drying sites, timber for masts and for ship building. In the note on the Strait of Canso between Nova Scotia and Cape Breton, Southack claims to have been the first Englishman ever to have sailed through it in 1690. The arm of Cape Cod shown as an island is a characteristic of Southack's New England coast charts. He had good reason to draw a strait in the vicinity of Eastham, Massachusetts, for he sailed a boat through it on April 26, 1717, when he was commissioned to take charge of a pirate ship which had been wrecked near there. Southack was not averse to naming places for himself, so we find the present Chedabucto Bay in northeastern Nova Scotia called Southack Bay, and Monhegan Island on the coast of Maine called "Southacks Island or Monhegan", in the Coasting Pilot, though neither name has survived. The New England Coasting Pilot was published by subscription and the leaf following the title page lists "The Names of those persons that have Subscribed Towards the Charge of Engraving and Printing This Work, for the Publick Good. His Excellency Francis Nicholson, Esq; was pleased to subscribe near One half part of the whole Expence. The following Persons, One Guinea each". There follow two columns of 73 names to which eight have been added in ink. Little wonder, then, that Southack dedicated the Coasting Pilot "To His Excellency Francis Nicholson Esqr. Governour, Captain General, and Commander in chief, in and over His Majesty's Province of South Carolina, and Vice Admiral of y same ..." (4). The three [original] copies of the map are located in the British Public Record Office, British Museum, and in the Library of Congress. |
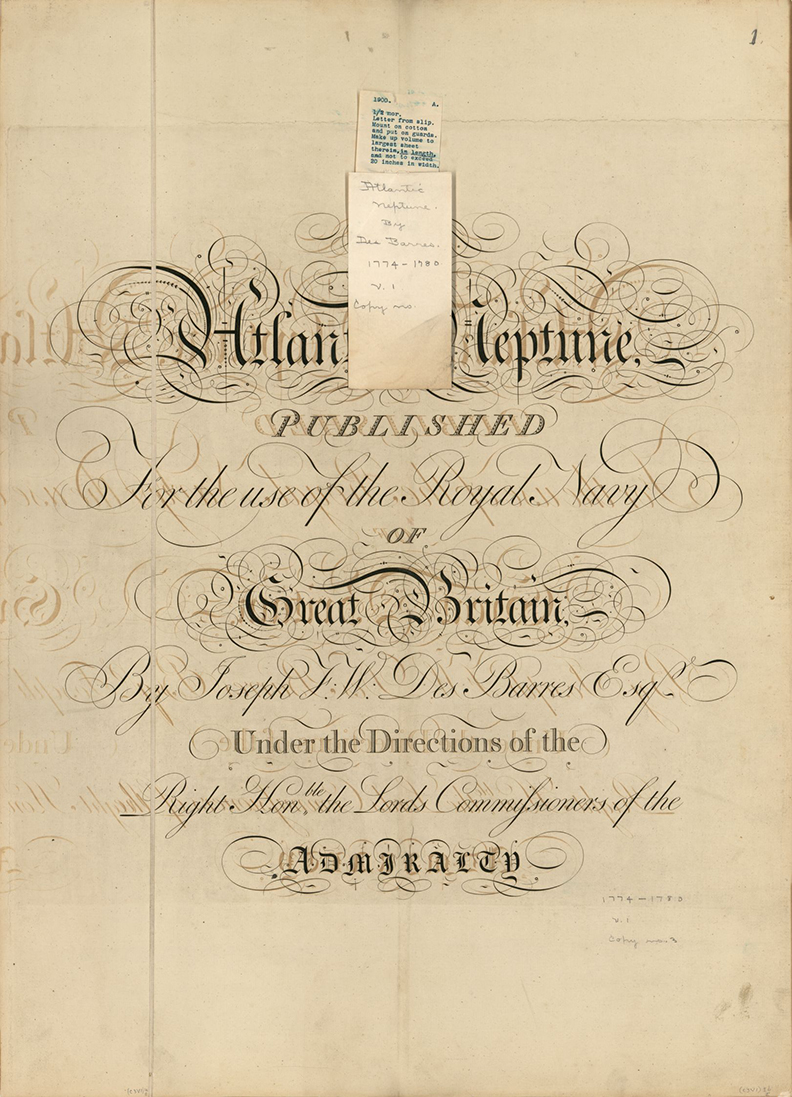 | 1776 Des Barres. The Atlantic Neptune.Source: Library of Congress Part of a large and diverse series of maps by Des Barres that cover the northeast region broadly from Newfoundland to New York. These range from finely detailed maps of very local features to regional charts on to coarser maps. Shown here are a number capturing the details of the coastlines and housing patterns on the Vineyard; it is important to remember that Des Barres was mostly interested in the coastline, so he often did not map the interior portions of the Island—there may have been settlements there, they are just not shown. Colonel Joseph Frederick Wallet Des Barres (1721 – 1824) was a British cartographer, born in Switzerland and trained for the military in England who sailed to North America in 1756 as a member of the fleet that attacked the Fortress at Louisborg. Shortly thereafter he began his life’s work charting the waters and land of northeastern North America. His most important work was the Atlantic Neptune, a monumental atlas of maps and charts in four volumes. Subsequently served as governor of Cape Breton Island (1784-1787) and governor of Prince Edward’s Island (1804 – 1812). He died at the age of 102. |
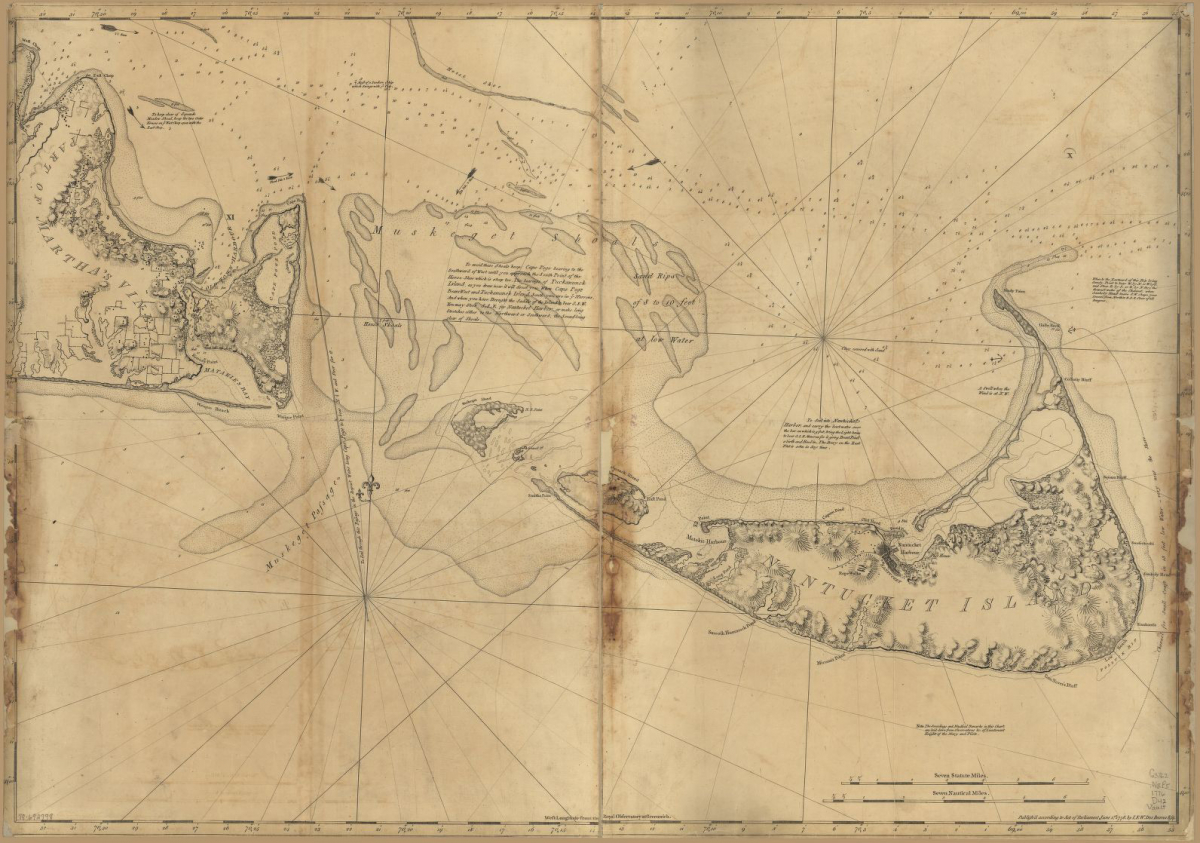 | 1776 Des Barres. Eastern Half of Martha’s Vineyard and Nantucket.Source: Library of Congress A fascinating early map that is equally tantalizing for what it does not show: the rest of Martha’s Vineyard. It would be great to be able to evaluate the housing, fencing, shoreline and other features for the remainder of the Island. [But, see 1781 Des Barres for the rest of the Island in less detail and 1781 Des Barres Buzzards Bay for the western half with fencelines]. In this view the patterns are intriguing and likely emblematic rather than accurate for most of Katama is broken into similarly sized and shaped fields bounded by fences and containing scattered houses. Enigmatically, many of the fencelines portrayed run north to south, whereas in 1850 and today the length of fencelines running east to west is much greater. In contrast the broad details of the coastline as portrayed here matches well with that a century later. There are incomplete patterns of fences elsewhere to the west and north along the coast, along Sengekontacket, and up towards East Chop where Des Barres showed less detail. Chappaquiddick, which is shown as a separate island with a breach near Waque Point. Details are unclear but it appears that a near connection exists between Poucha Pond and the marshes and pond at Wasque. At west end of “Matakies Bay” a series of small ponds appears to provide much of a connection to Edgartown Great Pond. On East Chop houses are concentrated up at Eastville. |
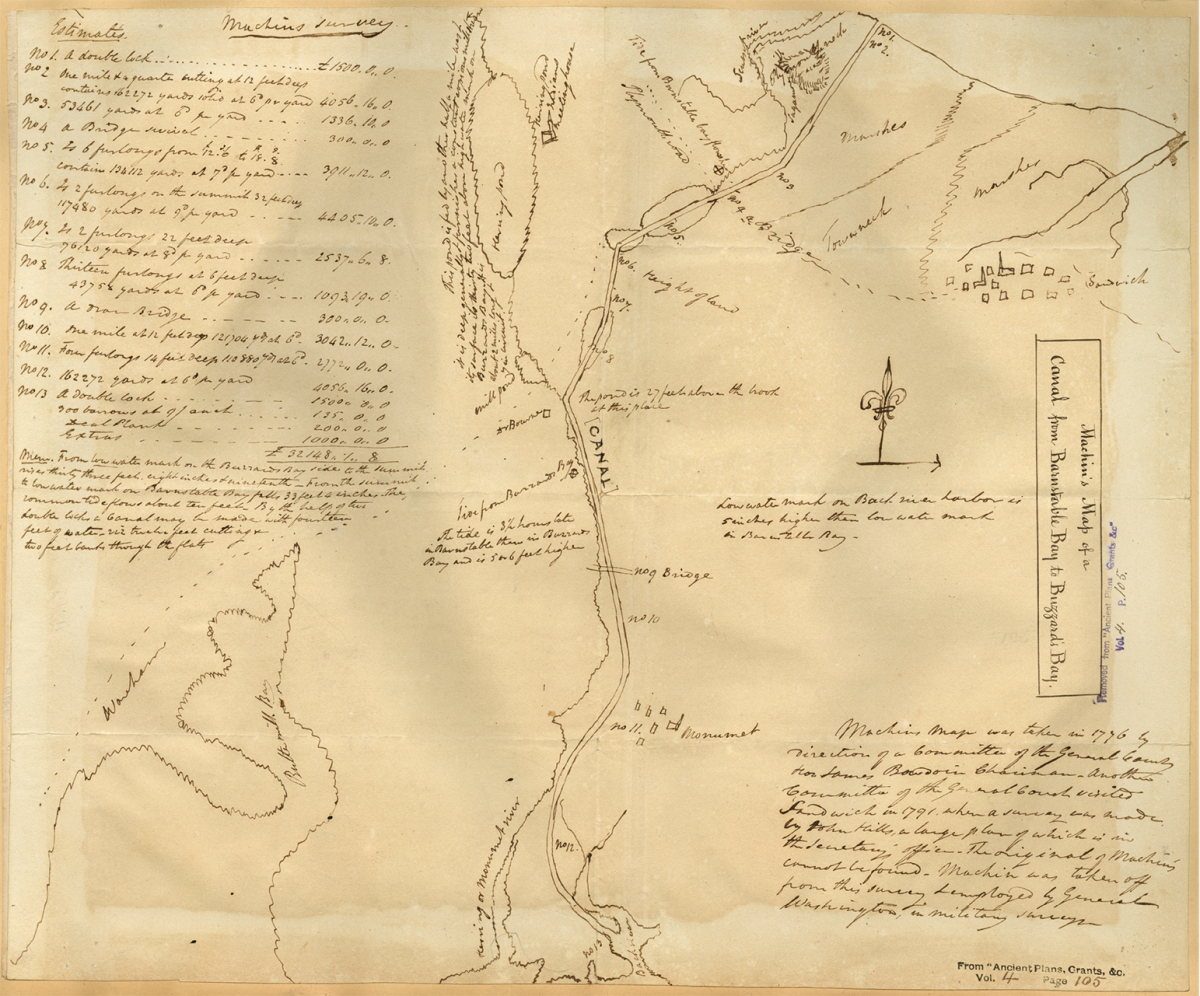 | 1776 Machin. Map of a Canal from Barnstable Bay to Buzzard’s Bay.Source: Massachusetts Archive From the early days of Plimoth Colony in the 1620s the low-lying area at the base of Cape Cod had been eyed as a possible location for a canal that would allow boats travelling the coast to avoid the lengthy transit though rough waters around the Cape. This area included the drainage of the Herring, Manomet, or Monument River into Buzzard’s Bay to the south and the Scusset River into Cape Cod Bay to the north. Approximately a mile of land with a maximum elevation of 33 feet above sea level separated the two rivers. According to the inscription this earliest official survey of the proposed canal was undertaken by Thomas Machin under the direction of the General County, James Bowdoin Chairman. Machin’s work was essentially a feasibility study requested by General George Washington with an eye towards enhancing security for the American fleet. Washington subsequently directed Machin to undertake other military surveys and the canal project was abandoned. See 1826 for a later and much more detailed plan of the proposed canal. |
 | 1781 Des Barres. Coast of New England from Chatham Harbor to Narraganset Bay (detail of the Vineyard and three windmills).Source: Norman B. Leventhal Map Center at the Boston Public Library Less detail but greater extent than 1776 map, including more place names; windmills near Eastville, Old Town, and the west end of North Road above Menemsha; meeting houses for Tisbury and Chilmark with road connecting; many houses on Chappaquiddick; Squibnocket Pond open to the sea near the modern townline; clusters of houses around Grey Pond (Seven Gates), Paul’s Point/Lambert Cove, and Norton Point/Makonikey. From the Atlantic Neptune: This chart of the southern coasts of Massachusetts and Rhode Island is representative of the level of detail contained in the charts of The Atlantic Neptune. The surveys of this coastline began in 1774, and were performed by engineers working under the supervision of Samuel Holland. With the inclusion of numerous soundings, the chart is able to convey the depth of the sea at various places in a two-dimensional form. Modern nautical charts use the same placement of soundings along coastlines to inform navigators of underwater dangers. It was imperative for 18th century mariners to have such safety information, as navigation of intricate and unknown coasts could be perilous. |
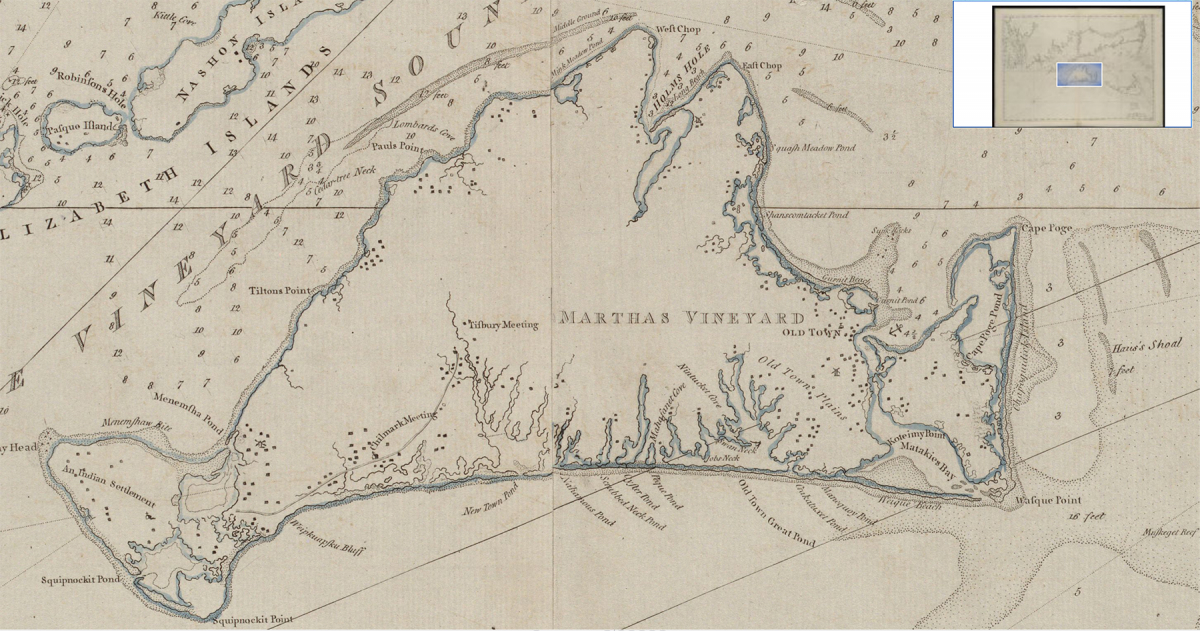
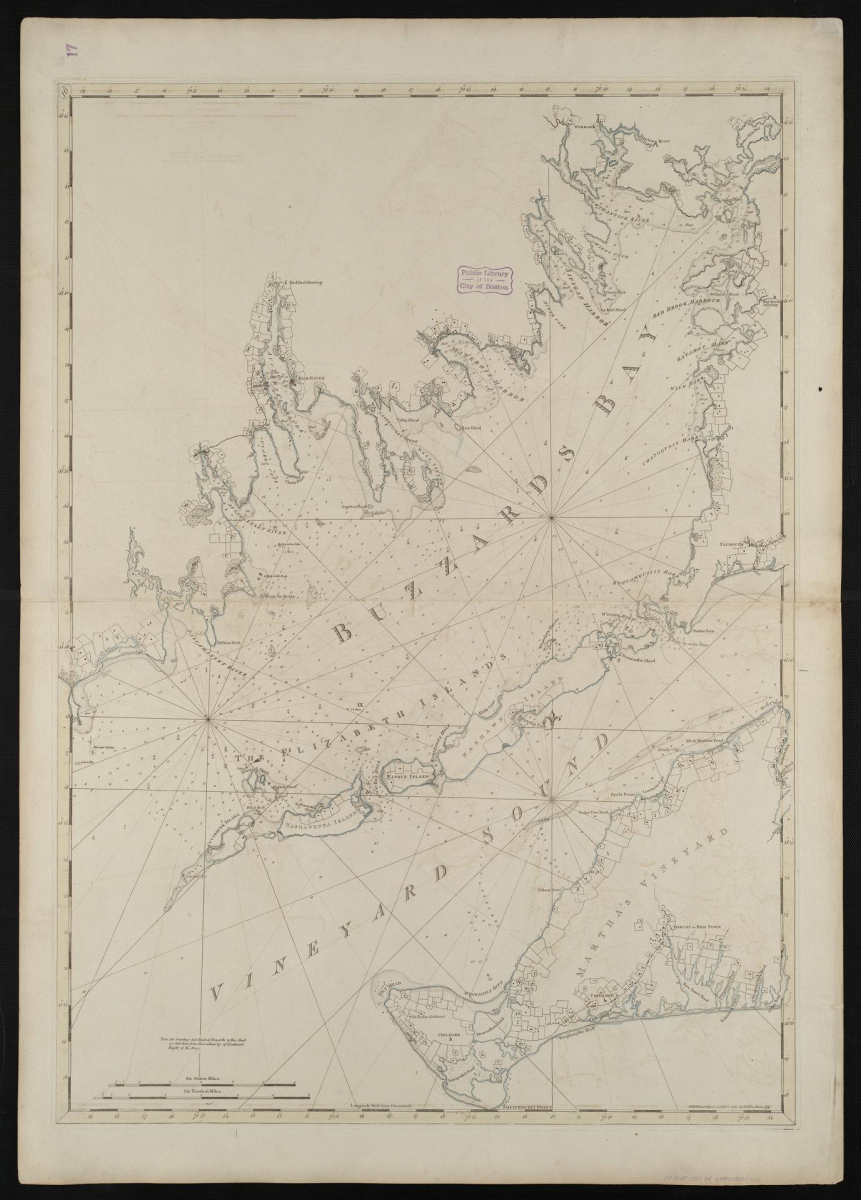 | 1781 Des Barres. Buzzards Bay and Vineyard Sound (Western Half of Martha’s Vineyard).Source: Norman B. Leventhal Map Center at the Boston Public Library Depicts details of houses, fence lines/parcel lines, and place names. Many interesting details: “Chilmark” associated with Gay Head meeting house, but village called “An Indian Settlement”; Moshup Trail area fenced in; Squibnocket Pond open; a windmill in Menemsha; bluff at Lucy Vincent Beach shown as an extension of the “Werpknapsku Bluff”; road from Tisbury to Menemsha Pond; many necks fenced off; native names for some south shore ponds; fences back a mile from the shore along the west side; “Konickey Cliff”; West Chop fenced in from the shores quite a distance; Middle Ground mapped as different depth and constituents than Lucas Shoal. |
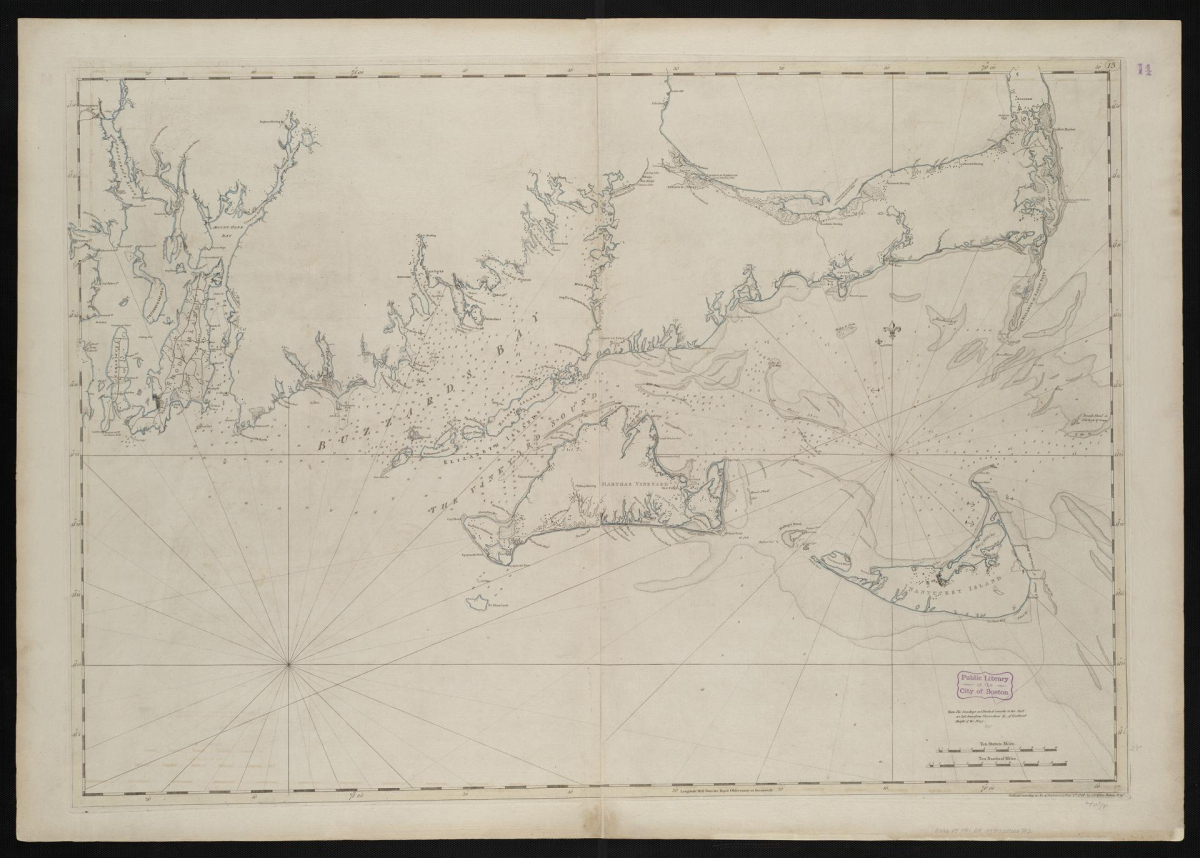 | 1781 Des Barres. Coast of New England from Chatham Harbor to Narraganset Bay (Martha’s Vineyard-Cape Cod).Source: Norman B. Leventhal Map Center at the Boston Public Library This is the full map where the windmill zoom-in image came from. We can see how concerned Des Barres was with the water depths of Buzzard’s Bay and Vineyard Sound. |
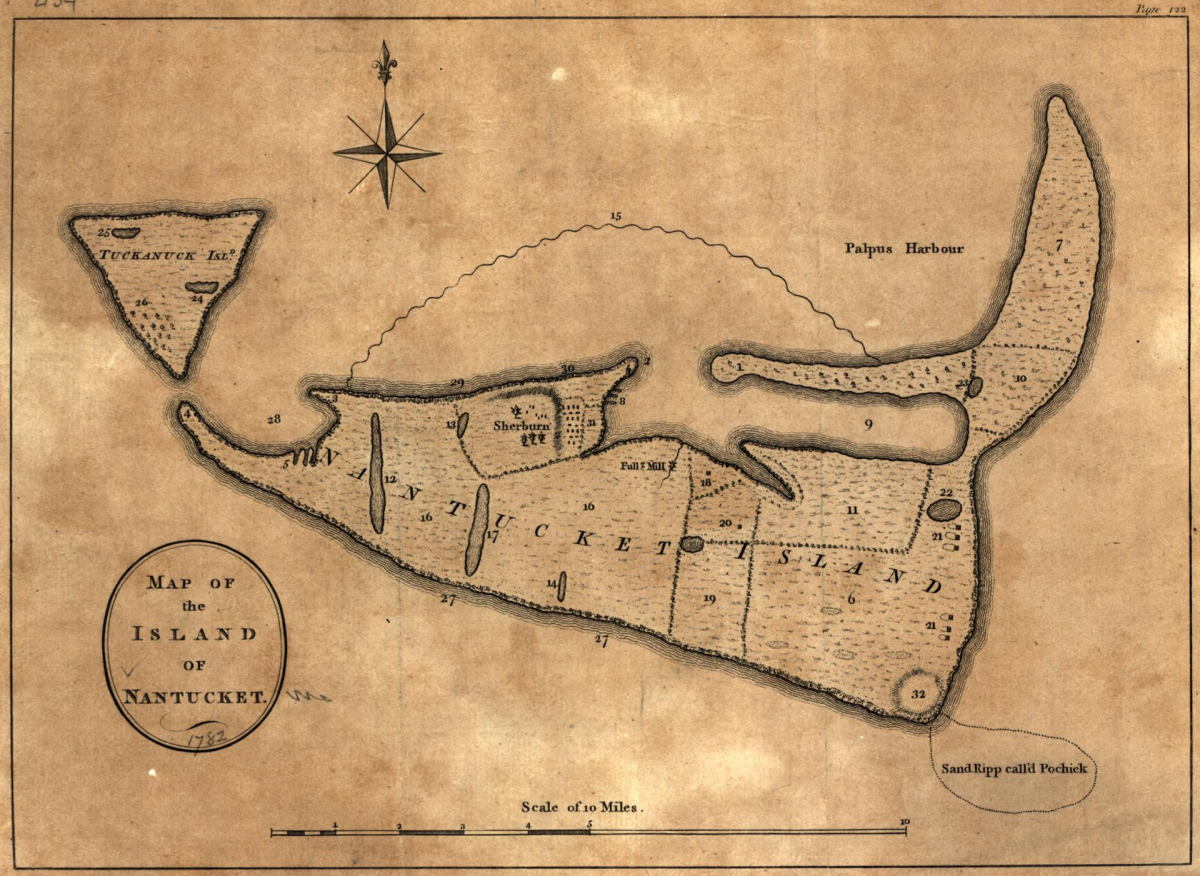 | 1782 Crèvecœur. Nantucket.Source: Norman B. Leventhal Map Center at the Boston Public Library The map come from J. Hector St. John De Crevecoer’s Letters from an American Farmer, which includes a lengthy description of Nantucket with considerably less information on Martha’s Vineyard. However, the map of Martha’s Vineyard is filled with great and interesting details on physical features and land-use history. In contrast to the map of Martha’s Vineyard, more wind mills appear on Nantucket but the details on land use and variation across the island is less. Most of the land is depicted as broken into a handful of extremely large pastures separated by fences. A fulling mill (for making woolen cloth from the large sheep herd) is depicted and cultivated fields occur to the west of the harbor. The numbers scattered across the island refer to a legend and list of place names that are depicted on the low resolution 1787 French-titled version of the map. Crevecoeur (1735 – 1813) was a French – American writer who immigrated to New France in 1755 and subsequently moved to New York where he became a citizen and purchased a large and prosperous farm. Relocating to London in the early 1780s he published his series of essays Letters from an American Farmer, which became a major success. The work described American life, principles, and character to Europeans in terms of the new country. Crevecoeur had many important American friends, including Benjamin Franklin. According to local legend St. Johnsbury, Vermont was named by Ethan Allen, who proposed St. John to honor his friend De Crevecoeur. De Crevecoeur suggested St. Johnsbury to differentiate it from Saint John, New Brunswick. There are English and French titled versions of both the Nantucket and Martha’s Vineyard maps. See 1787 |
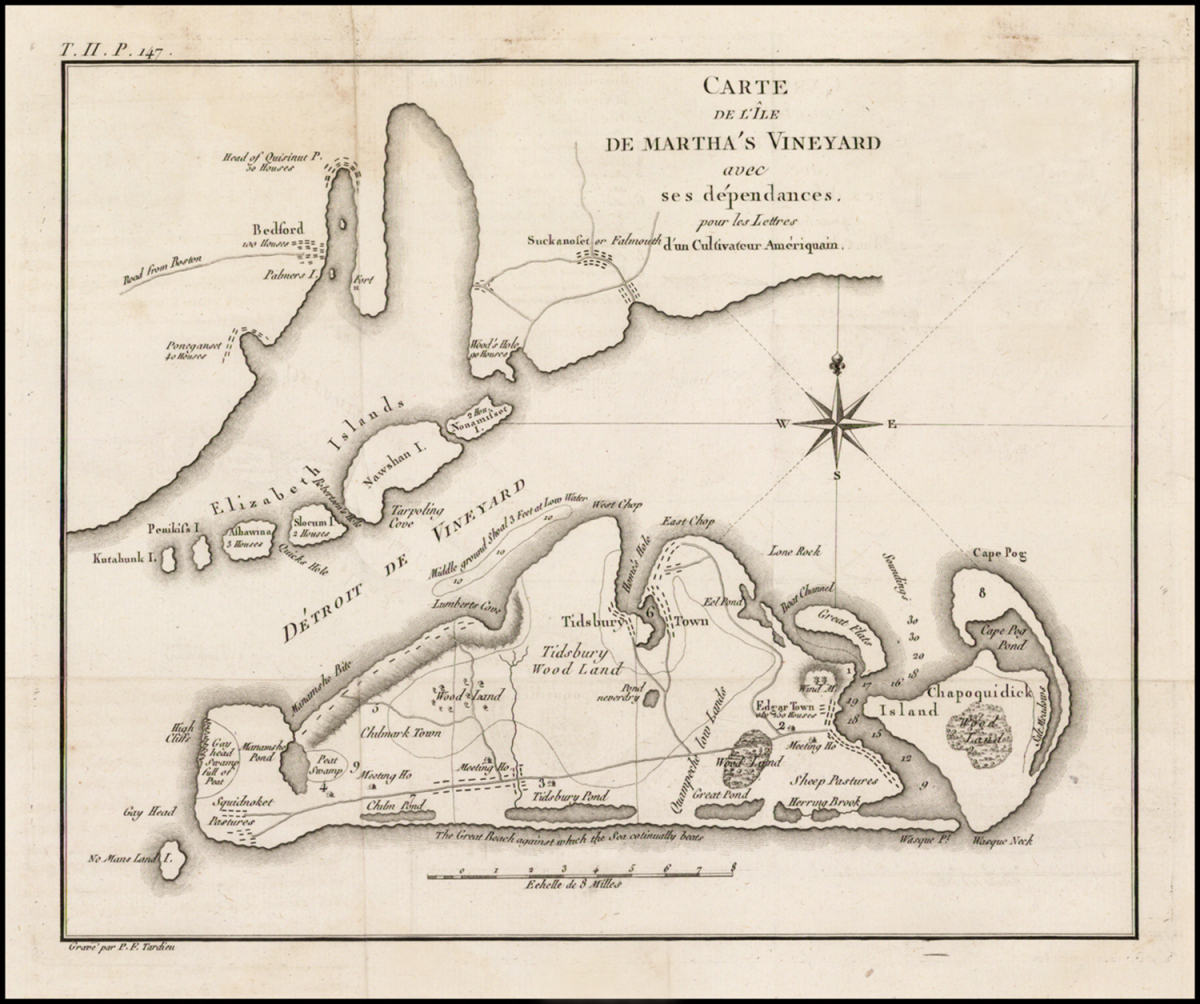 | 1784 Crèvecœur. Carte De L’Isle de Martha’s Vineyard avec ses dependencies.Source: Norman B. Leventhal Map Center at the Boston Public Library The map come from J. Hector St. John De Crevecoer’s Letters from an American Farmer, which includes a lengthy description of Nantucket with considerably less information on Martha’s Vineyard. However, the map of Martha’s Vineyard is filled with great and interesting details on physical features and land-use history. Large woodlands are depicted across the Great Plain, down towards Pohogonot, and out on Chappaquiddick. Squibnocket and Katama are referred to as sheep pastures, peat lands (presumably important as a source of fuel), are identified in Chilmark towards the shore of Menemsha Pond (where there are large swamps west of State Road) and out on Gay Head. Little Pond is termed the “Pond never dry” and the south coast is labeled as “The Great Beach against which the Sea continually beats”. The Poucha Pond salt marshes are not depicted. Though it is reported that De Crevecoeur relied extensively on correspondence for some of the details in the map one gets the strong sense that he examined the Island closely on his visit. Note the Elizabeth Islands and report on the number of houses: three on Nashawena, two on Slocum’s (Pasque) and two on Nonamisset. Penikese is shown as aligned with the rest of the chain of islands, and Woods Hole is reported as 90 houses In contrast to the map of Martha’s Vineyard, more wind mills appear on Nantucket but the details on land use and variation across the island is less. Most of the land is depicted as broken into a handful of extremely large pastures separated by fences. A fulling mill is depicted and cultivated fields occur to the west of the harbor. The numbers scattered across the island refer to a legend and list of place names that are depicted on the low resolution 1787 French-titled version of the map. Crevecoeur (1735 – 1813) was a French – American writer who immigrated to New France in 1755 and subsequently moved to New York where he became a citizen and purchased a large and prosperous farm. Relocating to London in the early 1780s he published his series of essays Letters from an American Farmer, which became a major success. The work described American life, principles, and character to Europeans in terms of the new country. Crevecoeur had many important American friends, including Benjamin Franklin. According to local legend St. Johnsbury, Vermont was named by Ethan Allen, who proposed St. John to honor his friend De Crevecoeur. De Crevecoeur suggested St. Johnsbury to differentiate it from Saint John, New Brunswick. There are English and French titled versions of the Martha’s Vineyard map. |
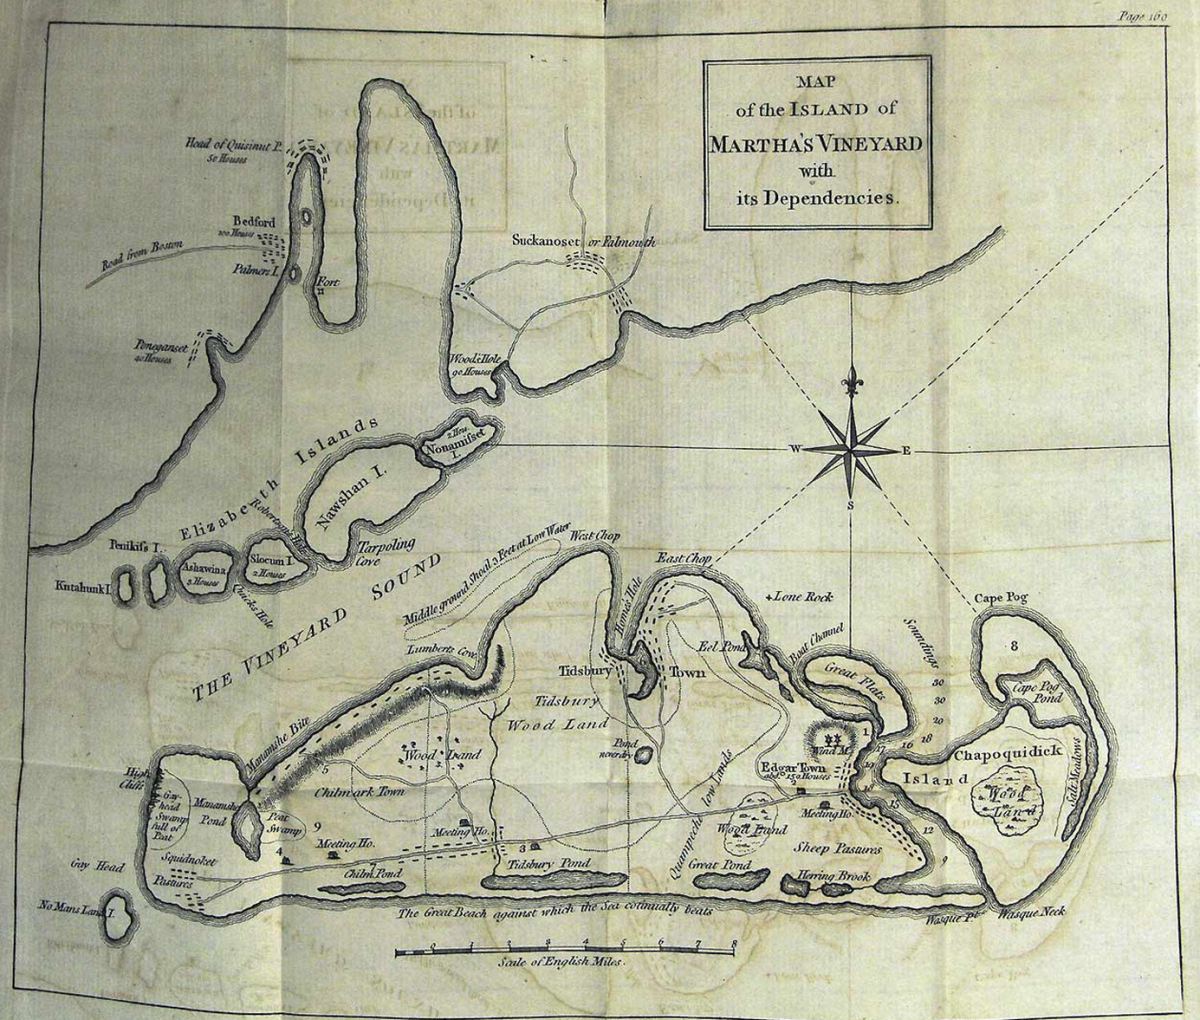 | 1784 Crèvecœur. Map of the Island of Martha’s Vineyard with its dependencies.Source: Library of Congress; Norman B. Leventhal Map Center at the Boston Public Library The map come from J. Hector St. John De Crevecoer’s Letters from an American Farmer, which includes a lengthy description of Nantucket with considerably less information on Martha’s Vineyard. However, the map of Martha’s Vineyard is filled with great and interesting details on physical features and land-use history. Large woodlands are depicted across the Great Plain, down towards Pohogonot, and out on Chappaquiddick. Squibnocket and Katama are referred to as sheep pastures, peat lands (presumably important as a source of fuel), are identified in Chilmark twoards the shore of Menemsha Pond (where there are large swamps west of State Road) and out on Gay Head, Little Pond is termed the “Pond never dry” and the south coast is labeled as “The Great Beach against which the Sea continually beats”. Though it is reported that De Crevecoeur relied extensively on correspondence for some of the details in the map one gets the strong sense that he examined the Island closely on his visit. Note the Elizabeth Islands and report on the number of houses: three on Nashawena, two on Slocum’s (Pasque) and two on Nonamisset. Penikese is shown as aligned with the rest of the chain of islands and Woods Hole is reported as 90 houses In contrast to the map of Martha’s Vineyard, more wind mills appear on Nantucket but the details on land use and variation across the island is less. Most of the land is depicted as broken into a handful of extremely large pastures separated by fences. A fulling mill is depicted and cultivated fields occur to the west of the harbor. The numbers scattered across the island refer to a legend and list of place names that are depicted on the low resolution 1787 French-titled version of the map. Crevecoeur (1735 – 1813) was a French – American writer who immigrated to New France in 1755 and subsequently moved to New York where he became a citizen and purchased a large and prosperous farm. Relocating to London in the early 1780s he published his series of essays Letters from an American Farmer, which became a major success. The work described American life, principles, and character to Europeans in terms of the new country. Crevecoeur had many important American friends, including Benjamin Franklin. According to local legend St. Johnsbury, Vermont was named by Ethan Allen, who proposed St. John to honor his friend De Crevecoeur. De Crevecoeur suggested St. Johnsbury to differentiate it from Saint John, New Brunswick. There are English and French titled versions of the Martha’s Vineyard map. |
 | 1787 Crèvecœur. Nantucket.See 1782 Crèvecœur, Nantucket. |
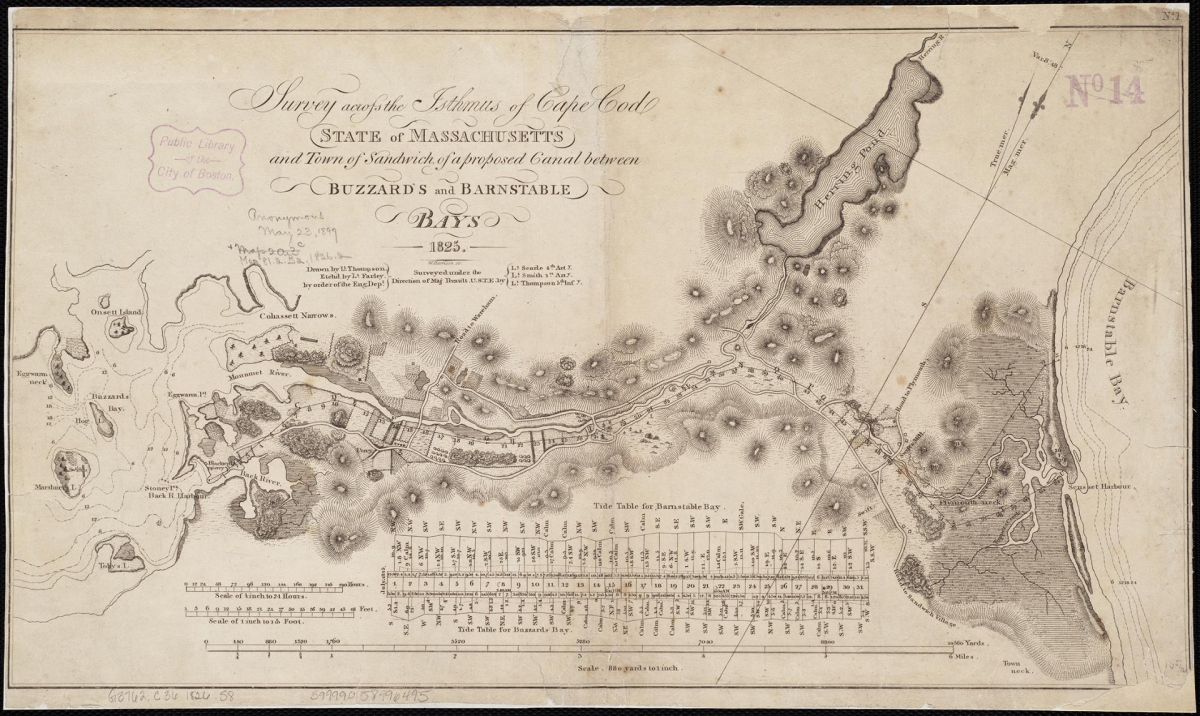 | 1826 U.S. Engineers. Plan for the Cape Cod Canal between Buzzard’s and Barnstable Bays.Source: Norman B. Leventhal Map Center at the Boston Public Library Although much more elaborate and detailed than their predecessors, the early nineteenth century plans for the Cape Cod Canal were no more successful in getting the project completed. Construction did not begin until 1909. |
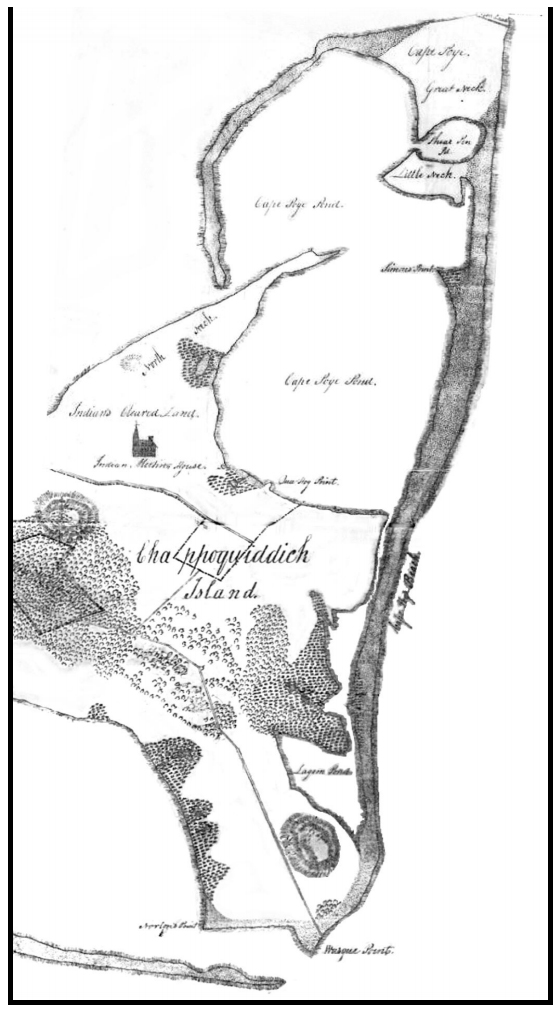 | 1830 Crapo. Chappaquiddick.Source: Martha’s Vineyard Museum In 1830 the legislature of the Commonwealth of Massachusetts required that every town produce a map showing the features of its land. The majority of towns responded with products of variable quality that are especially of ecological interest as they depict land cover (forest, open agriculture, wetland), roads, houses and occasionally other features such as pine plains, mills, ponds and streams). The Harvard Forest assembled all of the available maps from the Massachusetts State Archives, interpreted and digitized these and made them broadly available for use in academic and applied studies (see Harvard Forest 1830 Map). Since the mapping was done as the landscape approached its peak of forest clearing and agricultural land use, the resulting charts provide key insights into arguably the most important historical processes that continue to shape the forests today. As a consequence, wide use has been made of these, including incorporation of the widely employed state BioMap project that identifies the biodiversity priorities for land protection across the state. To our knowledge Massachusetts is the only state in the US where detailed land cover information was comprehensively mapped at such an early date. While some towns hired local surveyors to meet the state mandate many others commissioned accomplished surveyors and cartographers for this work. Henry Crapo (1804 – 1869), who produced maps on the Vineyard, including this version for Chappaquiddick lay somewhere between these extremes. Born in Dartmouth , Massachusetts he lived in New Bedford into the 1840s and was a land surveyor, auctioneer, town clerk and collector of taxes who developed a advanced ability as a map and chart maker. The map of Chappaquiddick is fairly detailed in terms of land cover and some aspects of land use as it shows the separation of Indian lands to the north, major roads, some fences, extensive woodlands and salt marshes, and place names. Much more could be done with a better version of this map. Subsequently, Crapo was drawn by investments in pine forests to Flint, Michigan where he became mayor and eventually developed a thriving timber industry and became heavily invested in lucrative railroad businesses. He ultimately served as governor of Michigan from 1865 – 1869. For more on the 1830 map see the Harvard Forest web page: 1830 Massachusetts Map Documentation 1830 Map of Land Cover and Cultural Features in Massachusetts |
 | 1845 US Coastal Survey Series (1845-1855) |
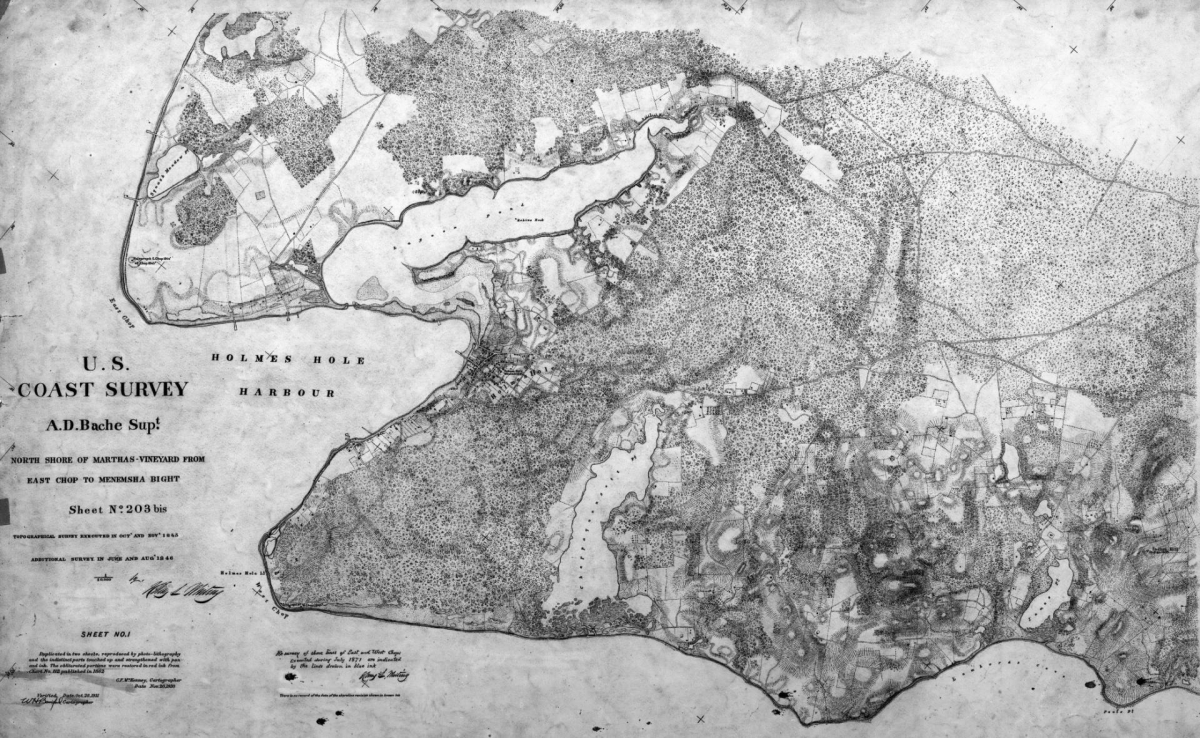 | 1846 Whiting. North Shore of Martha’s-Vineyard from East Chop to Menemsha Bight.Source: NOAA One of many detailed engravings resulting from the work by Whiting’s team. The topographical survey was conducted in 1845-1846. Notation on the map from 1930 indicates that Sheet No. 1 was duplicated in two sheets, reproduced by photo-lithography and then the indistinct parts were touched up and strengthened with pen and ink. The obliterated portions were restored from chart no. 112 published in 1862. |
 | 1847 Whiting. Harbor of Holmes’ Hole.Source: Norman B. Leventhal Map Center at the Boston Public Library A much refined and colored chart drawn from the Island-wide survey overseen by H.L. Whiting who was still an assistant at this time. The heavily forested condition of West Chop is apparent, extending right from the very edge of town. Eastville was a small thriving village with a single small wharf. Note the location of the wreck off the dock in Holmes Hole and the detailed farm and garden fields shown at the western edge of town. |
 | 1851 Maury. Global Whaling Chart.Source: Martha’s Vineyard Museum; Norman B. Leventhal Map Center at the Boston Public Library; Library of Congress Maury served as Superintendent of the U.S. Navy Depot of Charts and Instruments (U.S. Observatory) and collected information such as logs from whaling ships to depict the distribution of major types of whales, including the variation in their seasonal distribution. These maps have been used extensively with other sources to study the historical distribution, abundance and depletion of whale populations. Note the legend showing different whale species. |
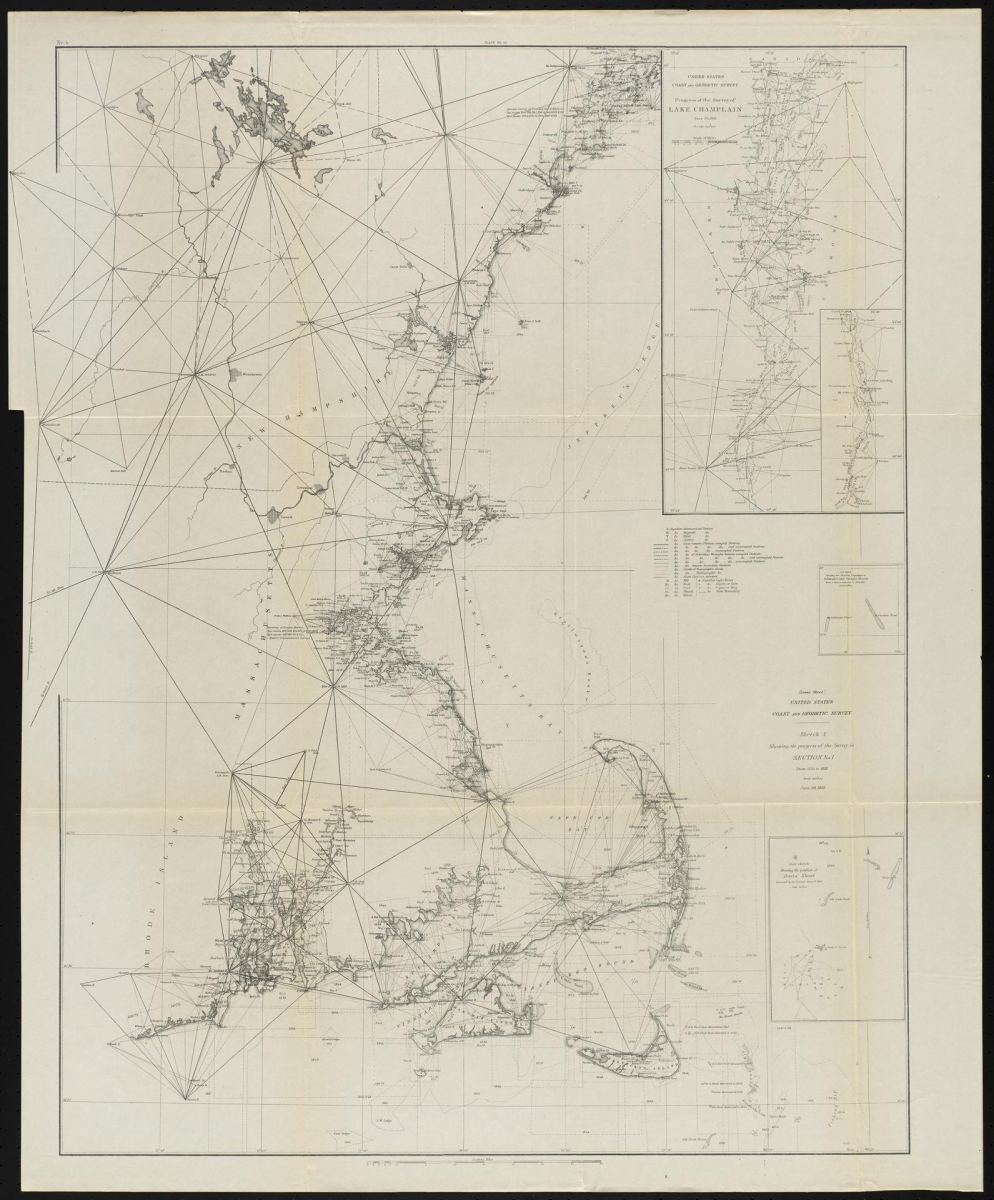
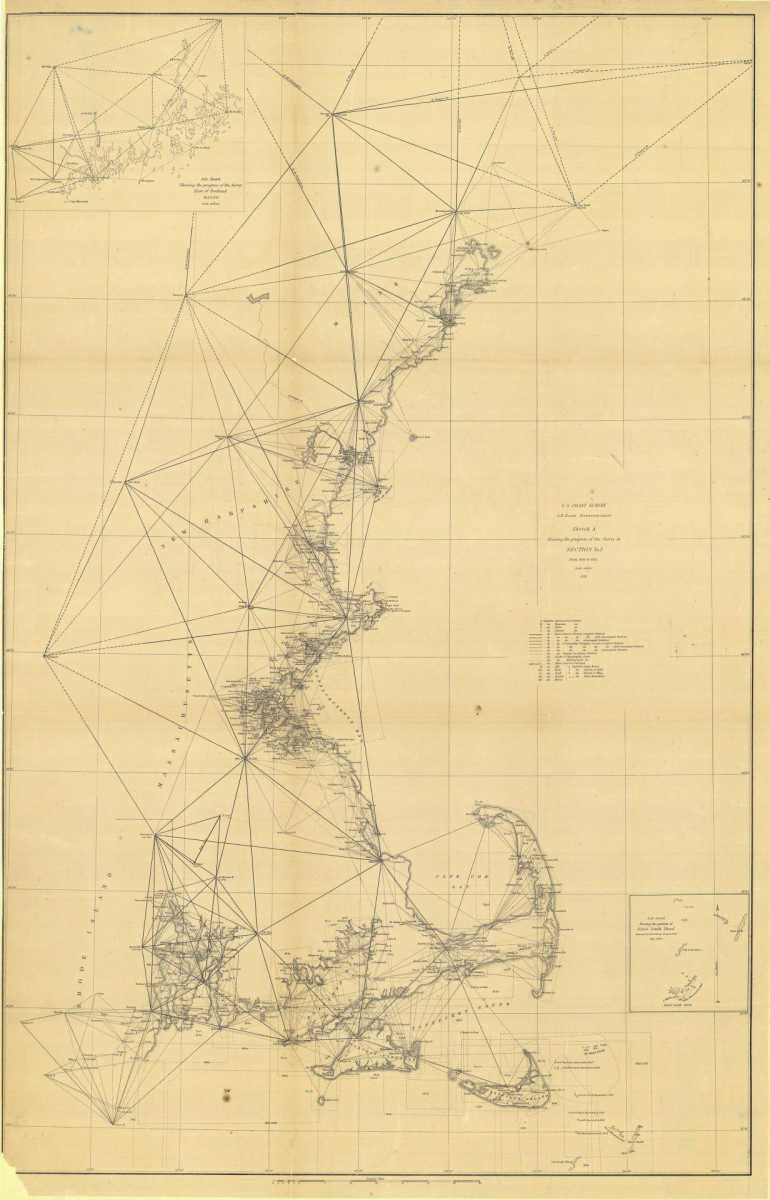 | 1851 US Coastal Survey. Sketch of the progress of the Survey (1844-1851).Source: NOAA Depicts the triangulation approach that was used for mapping, from Massachusetts to Portland, Maine. From these large triangles, nests of smaller triangles were constructed, to allow precise positioning of features in detailed local surveys. |
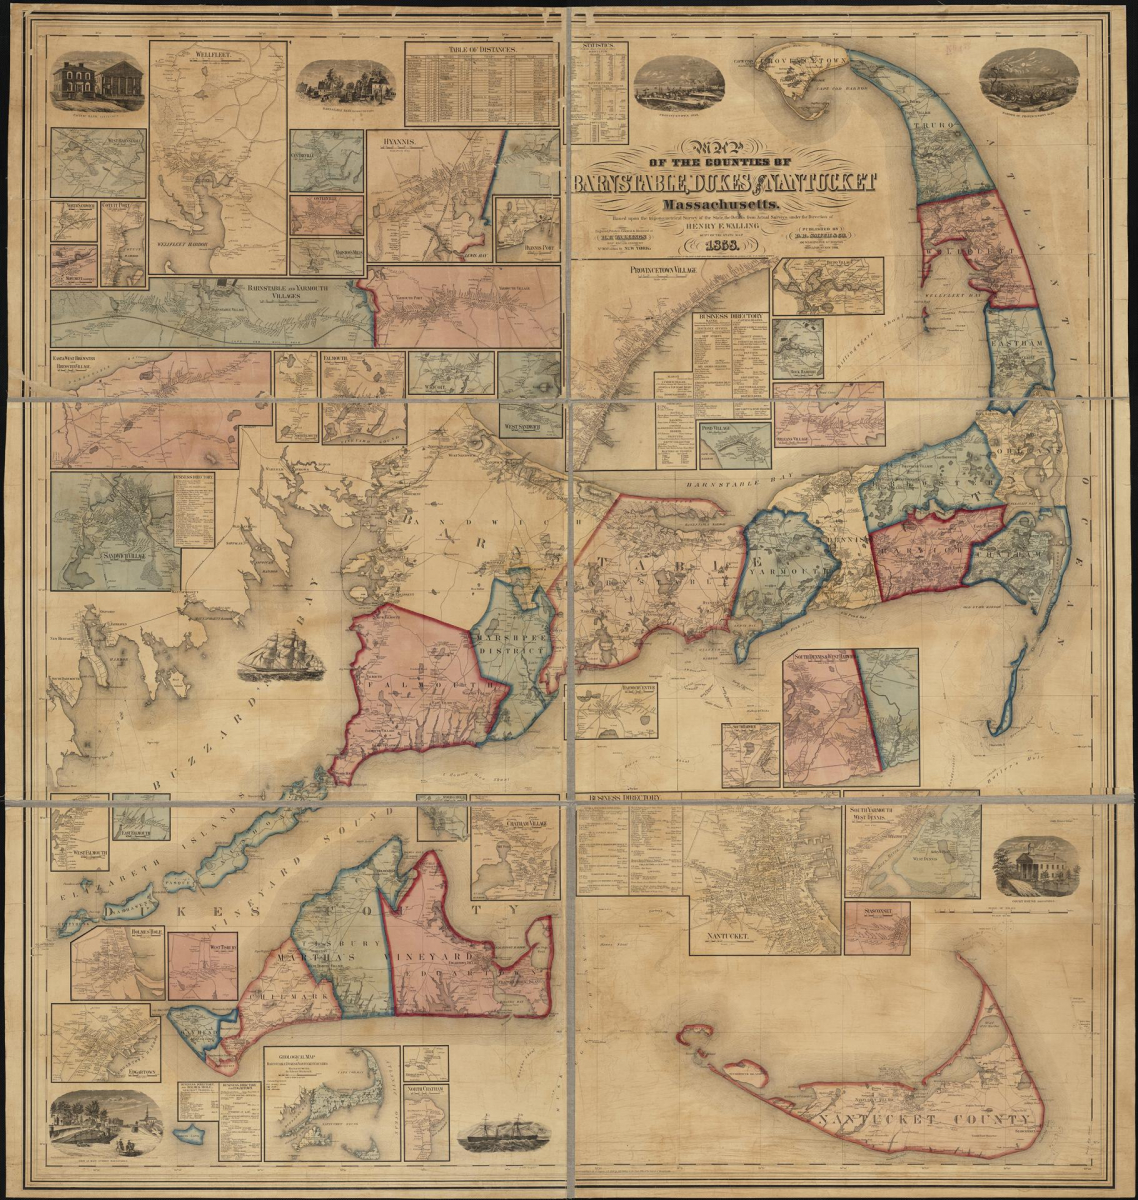 | 1858 Walling. Barnstable, Dukes and Nantucket Counties.Source: Library of Congress; Norman B. Leventhal Map Center at the Boston Public Library One of the many maps from among the state, county, and town maps produced by Henry F. Walling of New York City. The colorful map, in which adjoining towns are distinguished by different colors, is most notable by the fact that the owners of houses and other buildings are identified and industries and uses such as gristmills, shops, schools, fisheries, Detailed insets of each town and village center provide considerable detail that, among other things are helpful in locating the various buildings associated with Dr. Daniel Fisher’s oil and candle businesses in Edgartown. On the Vineyard a number of notable enterprises are shown in 1858: the Camp Meeting Ground, Lagoon Fishery (at the south end), Dr. Fisher’s oil shed, a wind-powered grist mill and school in the middle of the Edgartown plain above Katama, a fish house at Mattakeset Creek, the “Indian Lands” on North Neck, Herring Fishery, the Look, Luce and Athearn Grist Mills in West Tisbury, the Grist Mill and Brick Works on Roaring Brook, and the wind mill, Baptist Church, School, and Indian Lands out in Gay Head. The 1871 version has considerably less detail. Henry F. Walling was one of the most prolific and accomplished commercial map publishers in the U.S. in the late nineteenth century. In the 1850s and 60s, he focused on mapping of Massachusetts, first producing detailed maps of Massachusetts towns and then a set of wall-size Massachusetts county maps. The latter were produced though Walling’s commission by the legislature as “Superintendent of the State Map” where he had access to the best data including “Original Surveys.” A note on the 1858 map indicates that a “large portion of the Coast is laid down from materials obtained from the archives of the U.S. Coast Survey. Thus, it appears that Walling utilized existing state and federal data to play out the topographical and substantial geographical data for his mapping and then filled in details through ground-based work by himself and his staff. Later in his career Walling worked for the U.S. Coast and Geodetic Survey and then the U.S. Geological Survey, primarily on projects related to the mapping of New England and the Appalachians. |
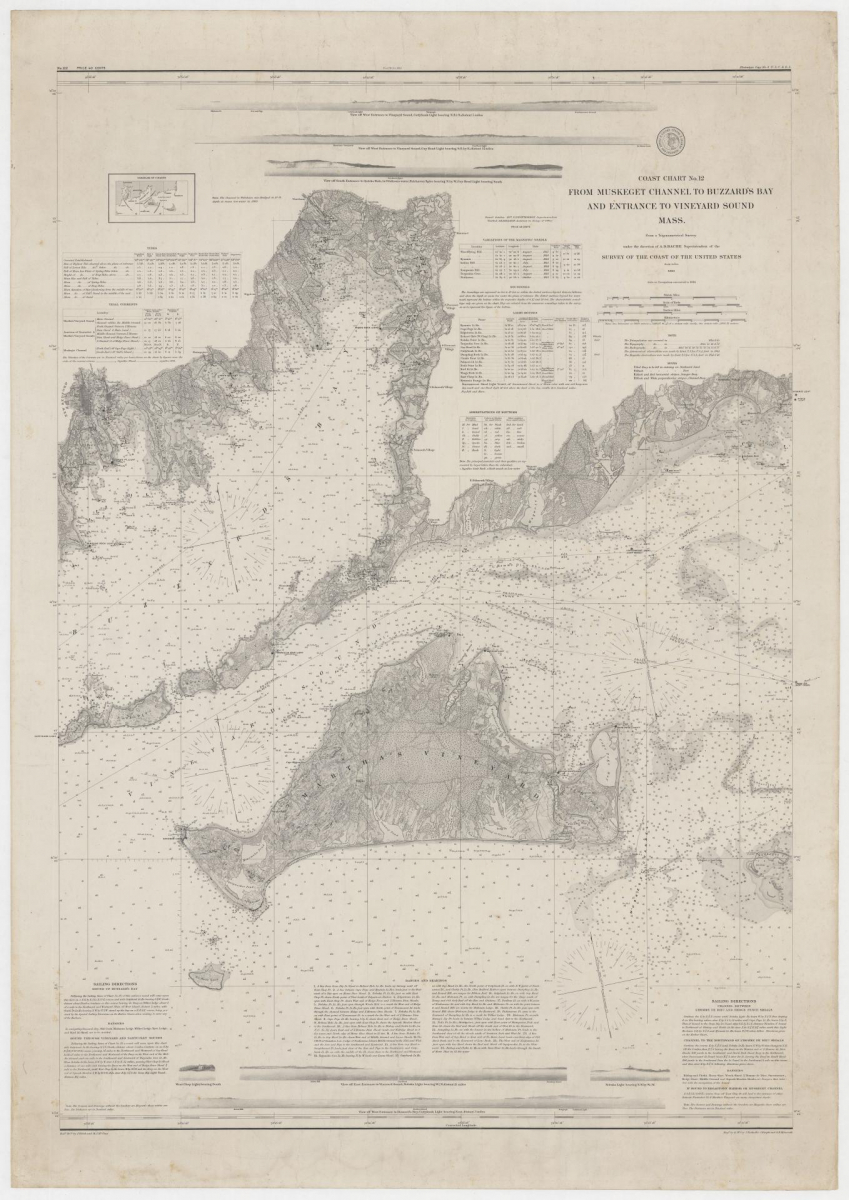 | 1860 US Coastal Survey. From Muskeget Channel to Buzzard's Bay and Entrance to Vineyard Sound Mass.Source: Dave Dandridge, Martha's Vineyard This map comes from the work of Henry Whiting’s crew of the U.S. Coastal Survey and was the basis for producing the 1850 H. L. Whiting map. The topographical work comes from the late 1840s and the hydrography derives from the early 1850s. |
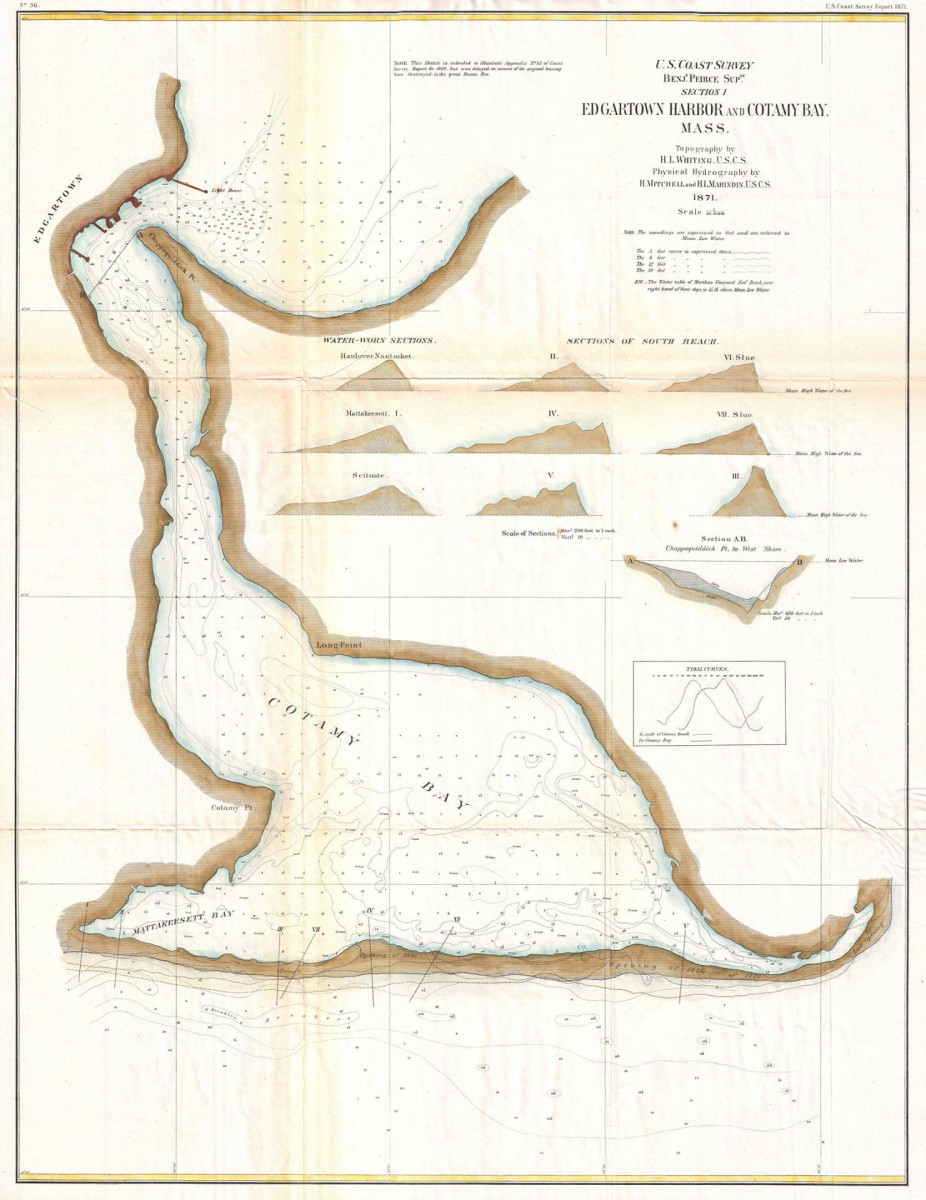 | 1871 US Coastal Survey. Edgartown Harbor and Cotamy Bay.Source: Digital Commonwealth; NOAA This map marks one of the great collaborations between two of the coastal Survey’s greatest scientists: Henry Whiting, cartographer who provided the topography and features of the land and Henry Mitchell (and in this case H. L. Marindin), hydrographer who provided the details on the bathymetry for the map. As related in The Meeting of Land and Sea, Mitchell and Whiting used this and subsequent work on the Vineyard, Katama Bay, and the opening at Norton Point to explain the broad dynamics of coastal erosion and the specific details of the forces that open and maintain, or lead to the closure of the bays and ponds on the south shore of the Vineyard. These studies are related in a series of U.S. Coastal Survey reports that are referenced in the volume’s bibliography. As noted on this map this specific chart relates to the report for 1869. The release of the report was delayed when the original was destroyed in the great Boston Fire of 1872, which destroyed 65 acres of downtown Boston. Aspects of the long-standing research by these two men are apparent in the details and insets of this 1871 map. From Whiting these include the light tracing of the position of the southern opening of Katama Bay (1776, 1846, 1856) and vertical cross-sections of the barrier beach that seals the bay along with comparative cross-sections from the barrier beach at the Nantucket haulover and at Scituate on Cape Cod. Whiting’s papers reference the tremendous erosion and movement of material from the beach out into the bay and beyond and so he feasibly collaborated with Mitchell to produce the inset depicting the Section (AB) running from Chappaquiddick Point to the West Shore. Note also how the topographical survey is tied into the location and elevation, above sea level, of the Martha’s Vineyard National Bank. As noted in the book Mitchell spent considerable effort studying the range, variation, and timing of the tides around the coast and especially on various positions inside and out of Katama (Cotamy) Bay. His inset graph comparing the tides inside and out served to bolster his explanation that the opening in the barrier beach was maintained by the tremendous erosive forces of the currents that sweep through that narrow channel, driven by the height differential of the water inside and outside the bay. |
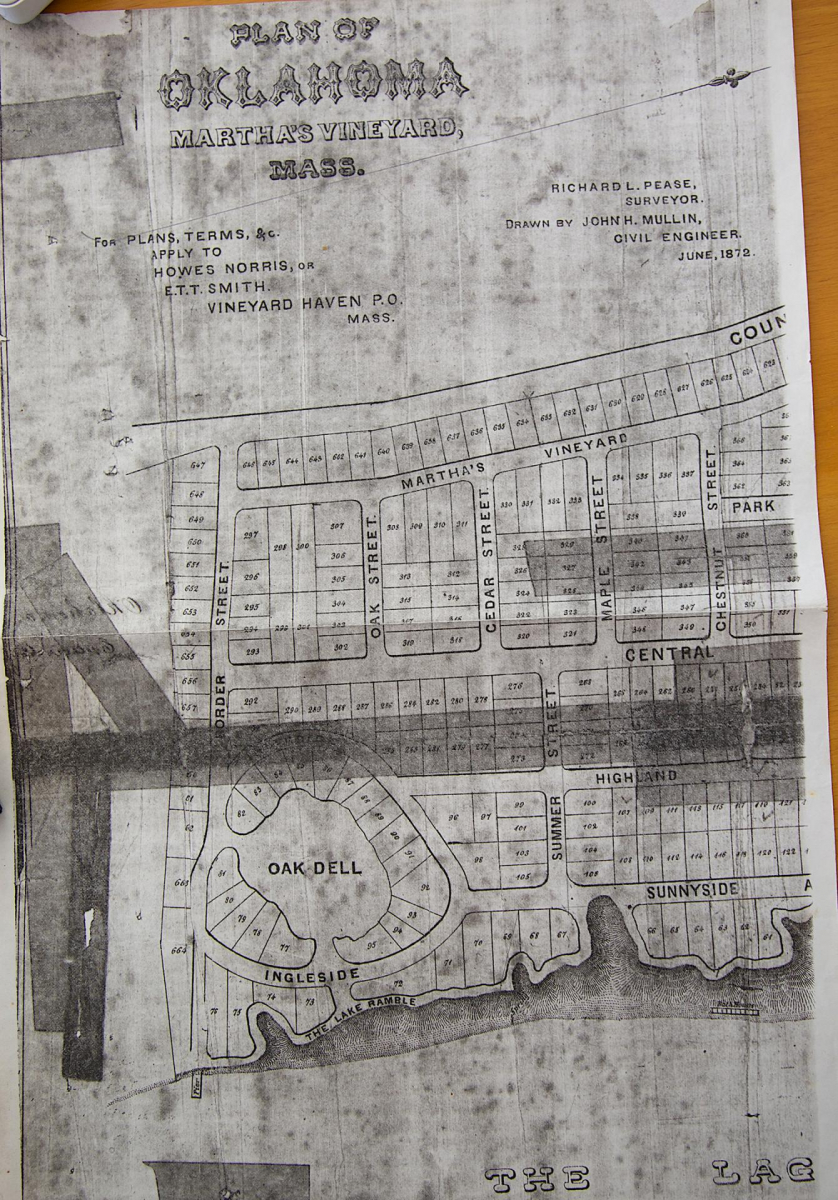 | 1872 Pease. Plan of Oklahoma.Source: Detail photographed on the dining room table of Nancy Weaver and David Dandridge who live on the edge of Oklahoma. The Martha’s Vineyard Museum apparently has the complete map (# 1996.060.001). The planned community at Oklahoma was one of many that struggled to get built and did not deliver on the investment return anticipated. This original plan would have placed about 500 homes on this oftentimes steep and rugged section of Vineyard Haven that lies delightfully hidden between Lagoon Pond and the Vineyard Haven-Edgartown Road. The realtor Henry Cronig became involved in the property in the 1950s and ultimately donated a nice small chunk of the unbuildable ravine, known as Brightwood Park, to Sheriff’s Meadow Foundation (SMF). The SMF preserve abuts the Land Bank’s Ramble Trail Preserve and Town Shellfish Hatchery, making for some nice walking. Surveyor Richard L. Pease, nephew of Jeremiah Pease, undertook considerable work on the Vineyard, and was much involved in major development plans such as Lagoon Heights. His historical materials helped form the early basis for much of Charles Banks’ work and he was notably involved in developing the census and report on the Inhabitants of Gay Head. |
 | 1873 Pease. Plan of Lagoon Heights.Source: Norman B. Leventhal Map Center at the Boston Public Library Pease teamed up again with Civil Engineer John Mullin to produce this map showing the detailed layout for Lagoon Heights on the eastern side of Lagoon Pond. In addition to the fine detail on the proposed development, which includes a cliff ramble, bath houses, and insets of some prospective structures along with numerous parks, the left side of the map contains a view from the site across the Lagoon towards West Chop. The scene captured in this time of extensive deforestation and intensive maritime activity is of a wide open landscape, a dozen or more large ships at anchor off Eastville with its strip of houses and other structures, and a solitary building situated on the northeast corner of the Lagoon. The value of this plan lies in its insights into the larger landscape as well as the expansive proposals for development on the Vineyard. Although construction did proceed and Barnes Road swings around this area today, many of the proposed details never materialized. |
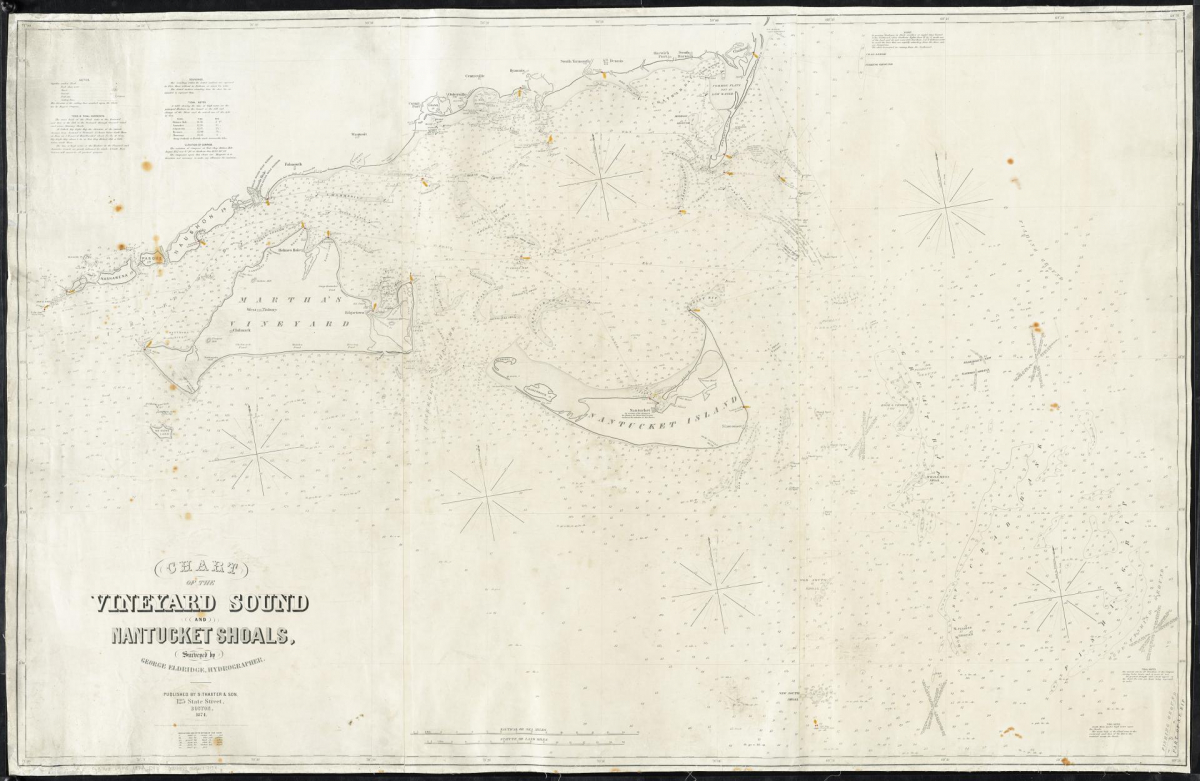 | 1874 Eldridge. Chart of the Vineyard Sound and Nantucket Shoals.Source: Norman B. Leventhal Map Center at the Boston Public Library George Eldridge (1821-1900) of Chatham, produced maps of the region based on US Coastal Surveys. The approach he took was to use good design and to include simple detail of the topography, soundings and other features. |
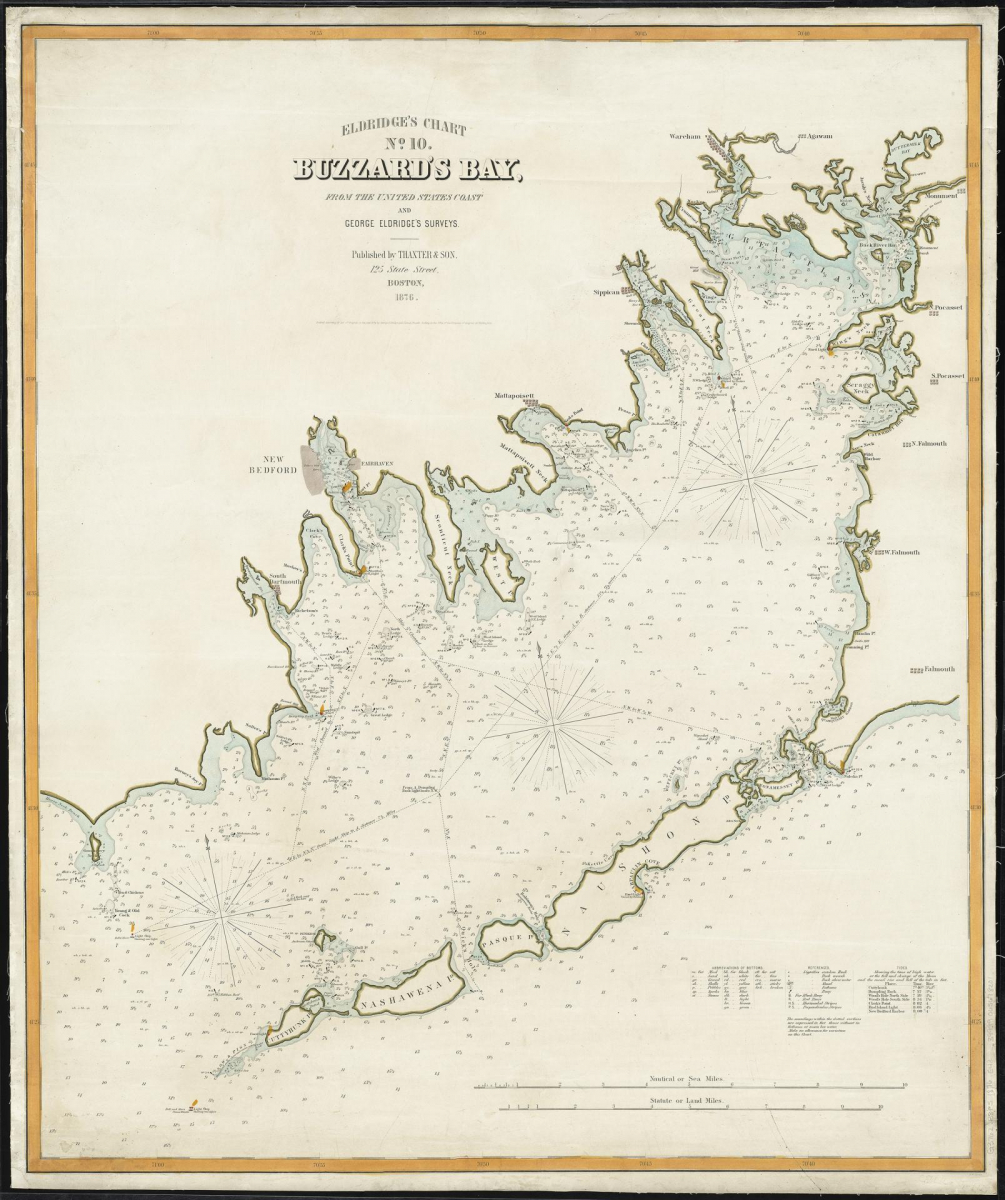 | 1876 Eldridge. Buzzards BaySource: Norman B. Leventhal Map Center at the Boston Public Library Description the same as above. |
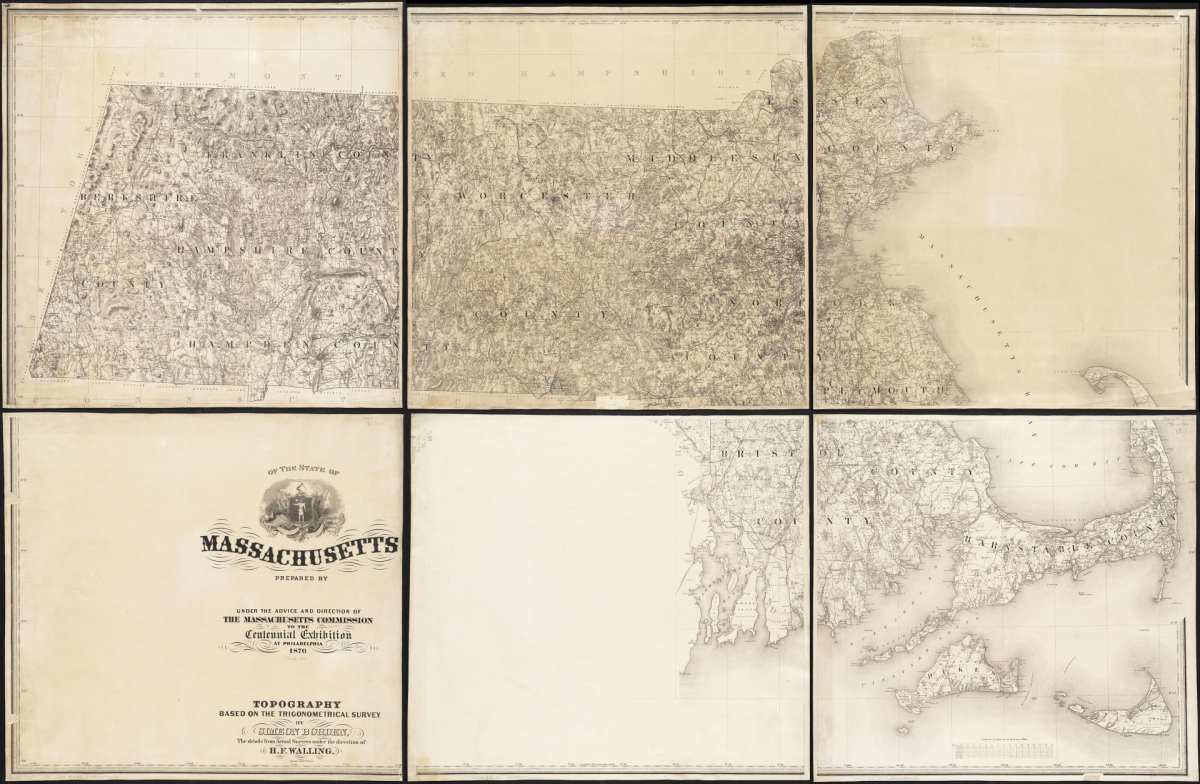 | 1876 Walling. The State of Massachusetts.Source: Norman B. Leventhal Map Center at the Boston Public Library |
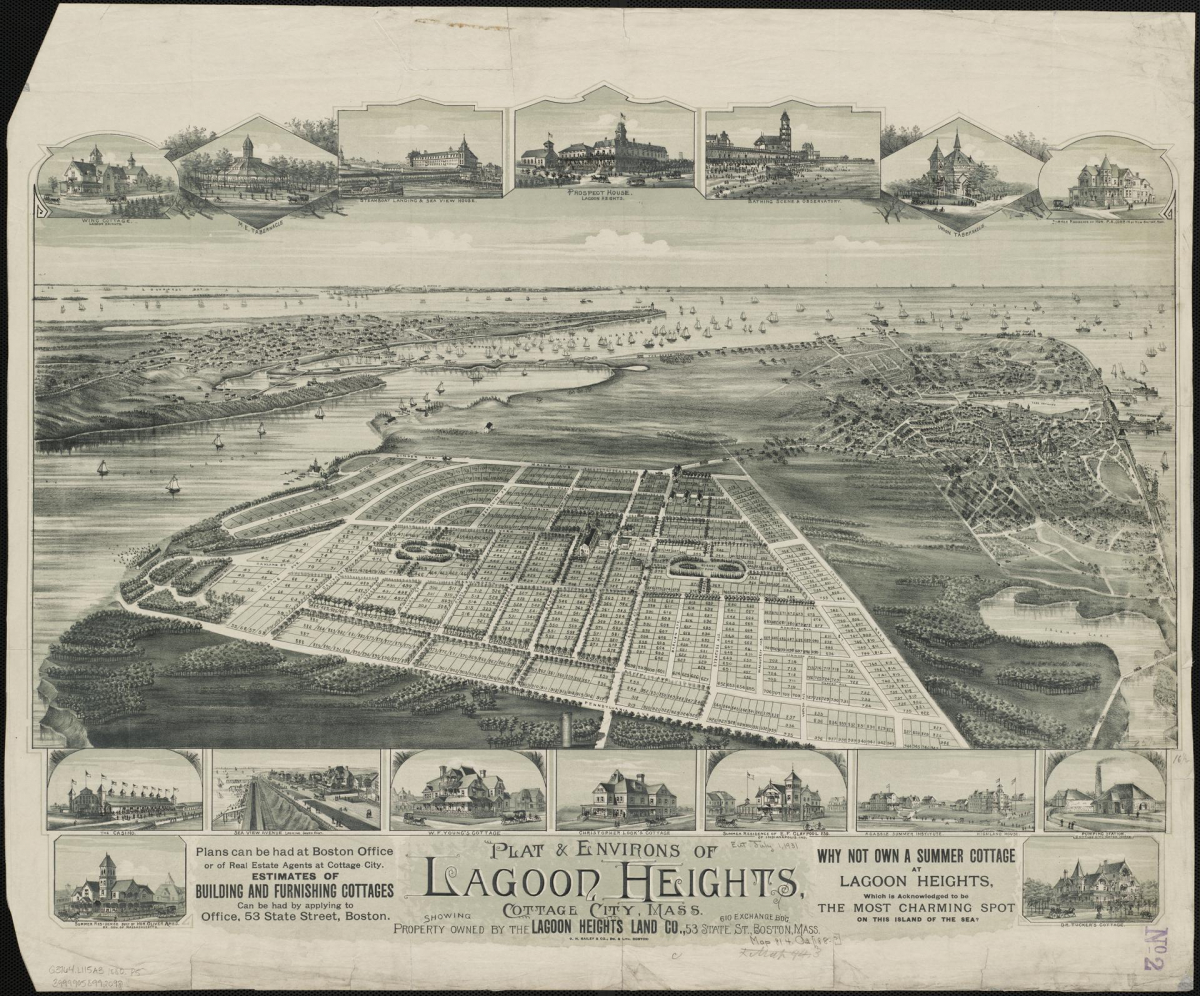 | 1880 Plat & Environs of Lagoon Heights.Source: Norman B. Leventhal Map Center at the Boston Public Library The oblique angle of this map provides a tremendous perspective on the character of the landscape across the broader area of East Chop, the north end of the Lagoon, Vineyard Haven, and out onto West Chop in 1880. Eastville remains thriving with two wharfs – New York and Norris (named for Howes Norris); the detailed insets help interpret the busy scene in Oak Bluff with the two tabernacles, Union Chapel, Cottage City and Highlands wharfs, and many hotels including the Highland House adjacent the Agassiz Summer Institute; to the south the road traversed Island Lake (Farm Pond) in the direction of a much exaggerated Lagoon Heights and to the west of town most of the area between Eastville, the Lagoon and the Heights remained empty; towards Vineyard Haven the Beach Road was fully connected over a bridge and two small bridges or walkways provided access out towards Cedar Neck; and out on West Chop the land remained largely forested. The details for the Lagoon Heights development owned and marketed by the Lagoon Heights Land Company, State Street in Boston, are fleshed out well beyond those on the 1873 map by Pease. Many modern streets are depicted – among them Lindon, California, Columbia, Washington and Pennsylvania Avenues – but Maine has become Barnes Road and Front Street has been reduced to just a vestige of a planned formal eastern end to the new neighborhood. |
 | 1881 USCGS. Sketch of the progress of the Survey (1844-1881).Source: NOAA See progress map of 1851. Includes an inset of progress around Lake Champlain. The USCGS remapped the coastline approximately every 30 years or so, thus their maps are a valuable source of information about changing coastlines, ocean depths, wetlands, and development patterns. These maps have been used by scientists across the United States to understand both the historical past and modern environmental challenges. |
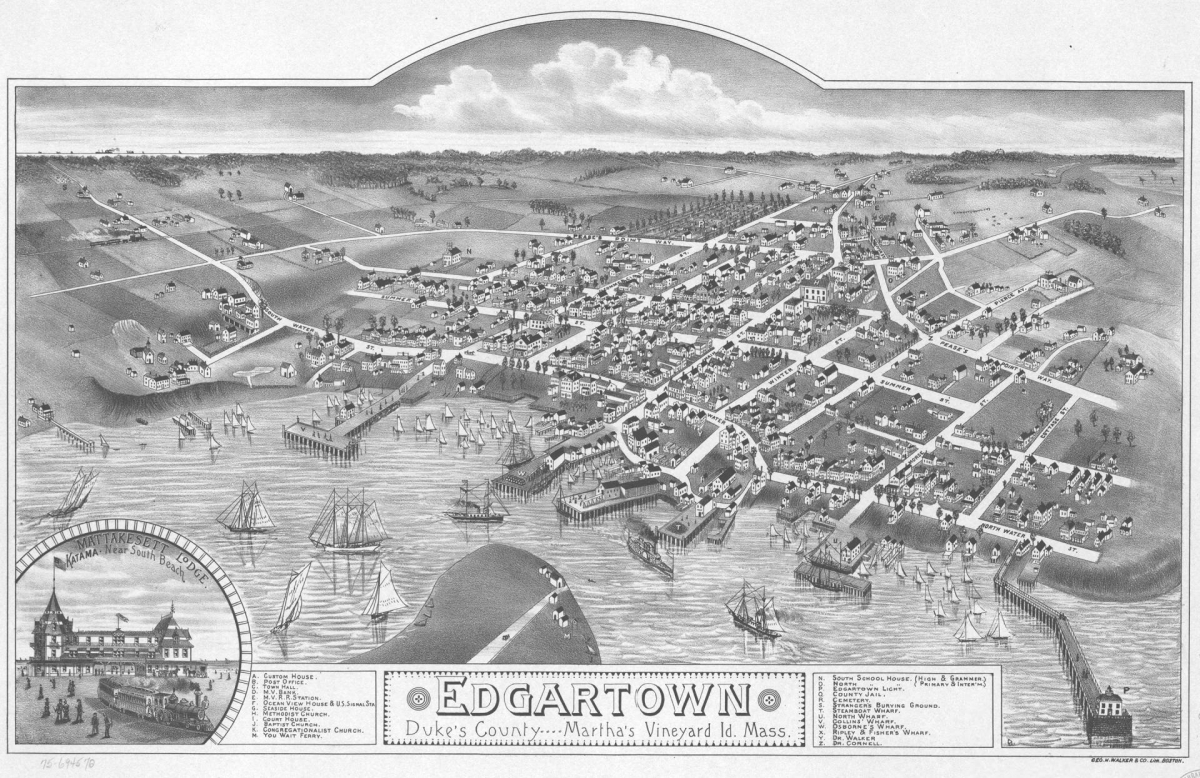 | 1886 Edgartown Birdseye View.Source: Library of Congress; Norman B. Leventhal Map Center at the Boston Public Library Past the glory days of whaling and Dr. Fisher’s oil business, Edgartown shows bustling trade of pleasure and business craft powered by steam and wind and five substantial wharfs, but still lies neatly contained by surrounding farm fields and open land. Notable features include the railroad smoking its way across the Katama Plain towards its rail station near the current County Jail (located on the old site of Dr. Fisher’s oil warehouse at the outskirts of town), the North and South School Houses, the lighthouse perched at the end of its pier, the cemetery with its near pastoral setting, and the buildings on Chappaquiddick Point associated with the “You Wait Ferry”. |
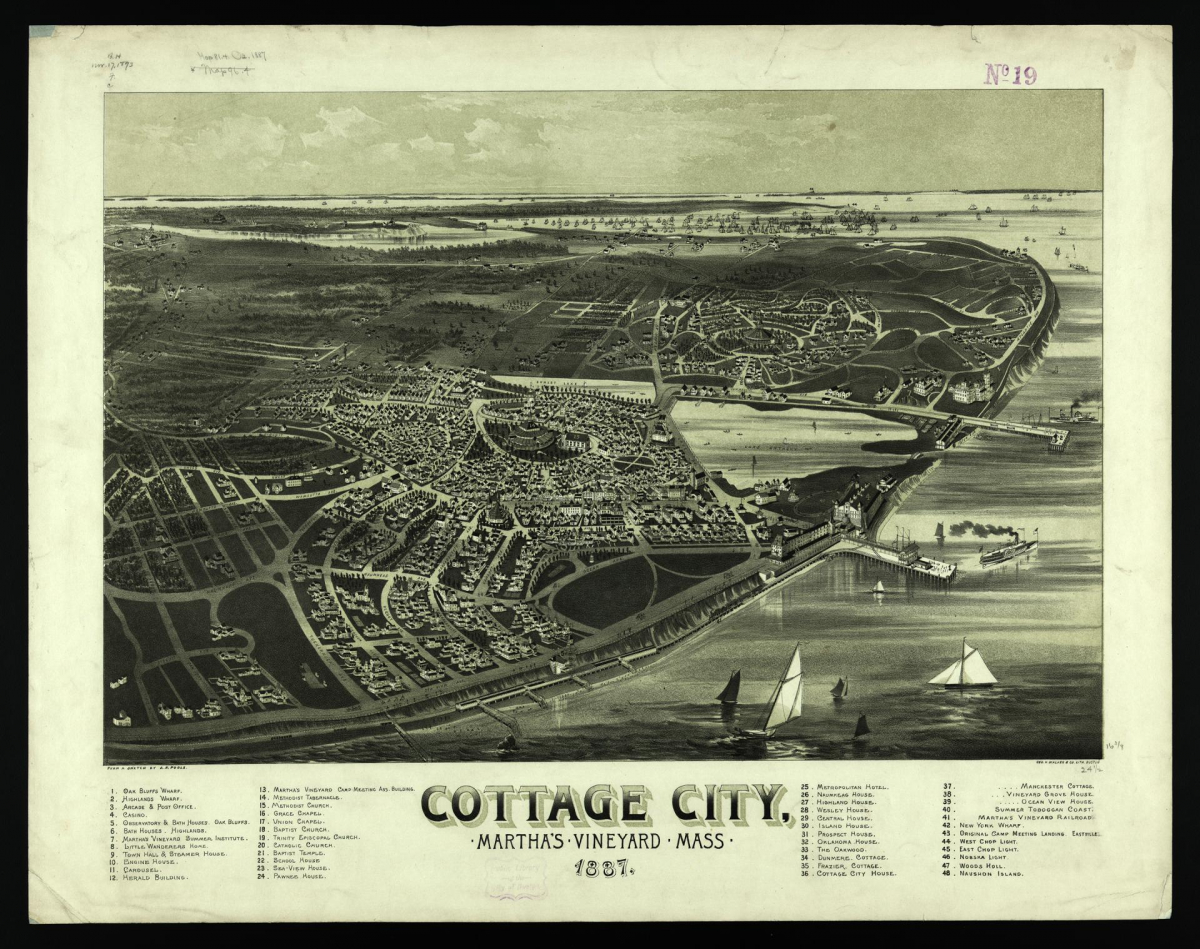 | 1887 Cottage City Birdseye View.Source: Norman B. Leventhal Map Center at the Boston Public Library Among the many striking aspects of this map is the contrast between the tightly developed qualities of the Oak Bluffs, Campground, and Highlands areas and locations further out on East Chop or back down towards Lagoon Heights where Prospect House is the distinguishing feature. The Harbor is packed with boats, the Norris (original Camp Meeting landing) and New York Wharfs persist at Eastville, the drawbridge stretches across the opening in the Lagoon, and the “Oklahoma House” is perched on the western Bluff of the Lagoon across from Prospect House. |
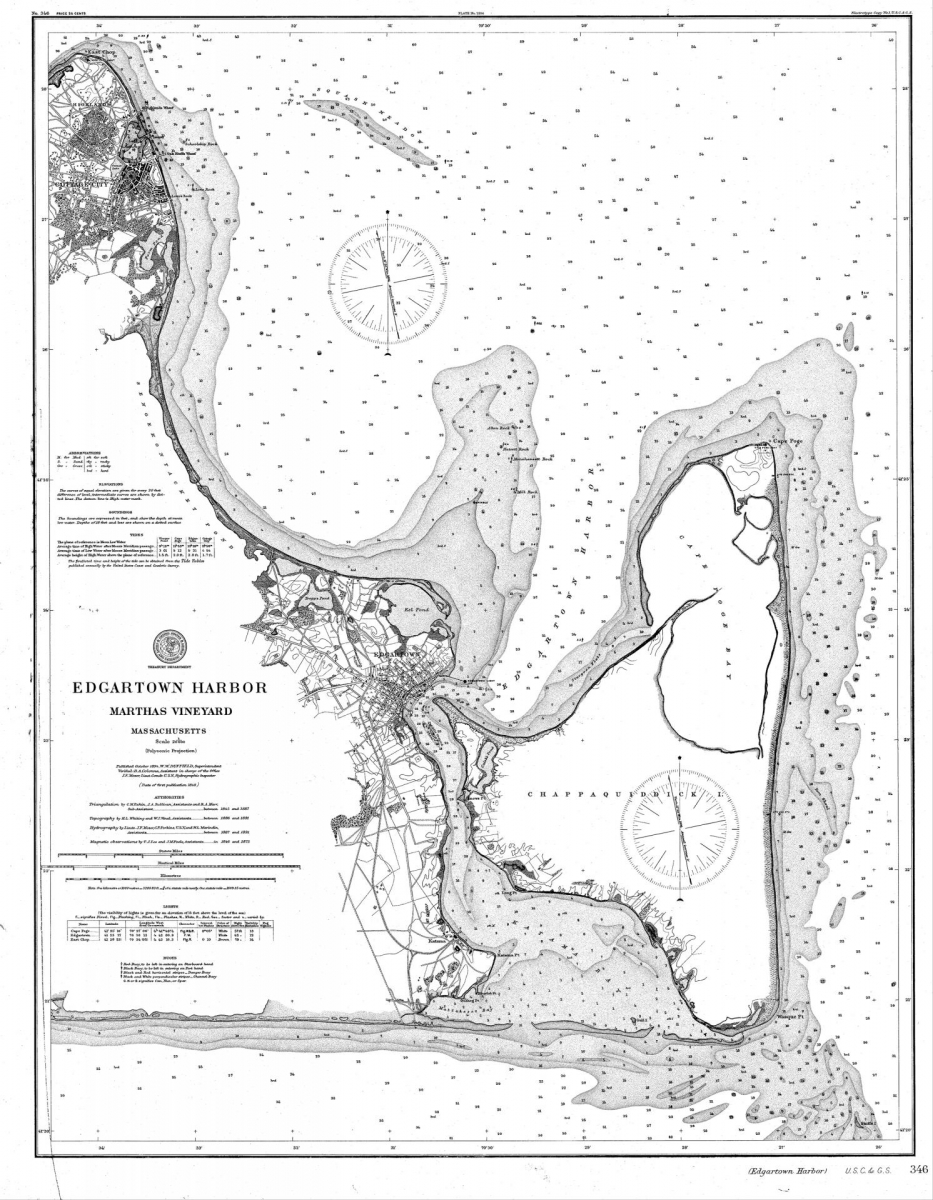 | 1887 U.S. Coast and Geodetic Survey. Edgartown Harbor.Source: NOAA The accompanying description (below) provides much information on this map within the context of the larger effort by NOAA to make the work of the Coastal Survey widely available. A nearly identical description is provided for the second version of this map # CP2731C, which differs in minor details, including not showing the Martha’s Vineyard Railroad, which had been removed. Notes on the map indicate that this was first published in 1848, the topography was conducted by H.L. Whiting and W.I. Vinal between 1886 and 1891, and the map was published in 1894. Background: Office of Coast Survey's Historical Map & Chart Collection covers the land and waters of the United States of America, including territories and possessions (past and present). Collection contents are diverse as a result of a rescue effort that began in 1995 to digitally preserve NOAA’s historical assets that were housed in an old printing facility in Riverdale, MD. The rescue effort concluded in 2004 and hard copies of those documents are available at the National Archives. Today, NOAA continues scanning efforts with partners such as the Library of Congress to fill holes in the Collection and ensure that the best digital copy of our maps and charts are available. Over this 15+ year scanning project, information about each chart/map was manually recorded and transferred to a database with limited quality control. We strongly recommend that you visually verify the accuracy of the supplemental information provided by comparing it against the scanned document. If you find errors or have additional questions, please submit an inquiry through http://ocsdata.ncd.noaa.gov/idrs/inquiry.aspx?frompage=Historicals and someone from our team will contact you. Image Information: The following information is automatically populated from the Historical Map and Chart Collection database. Filename: CP2396C |
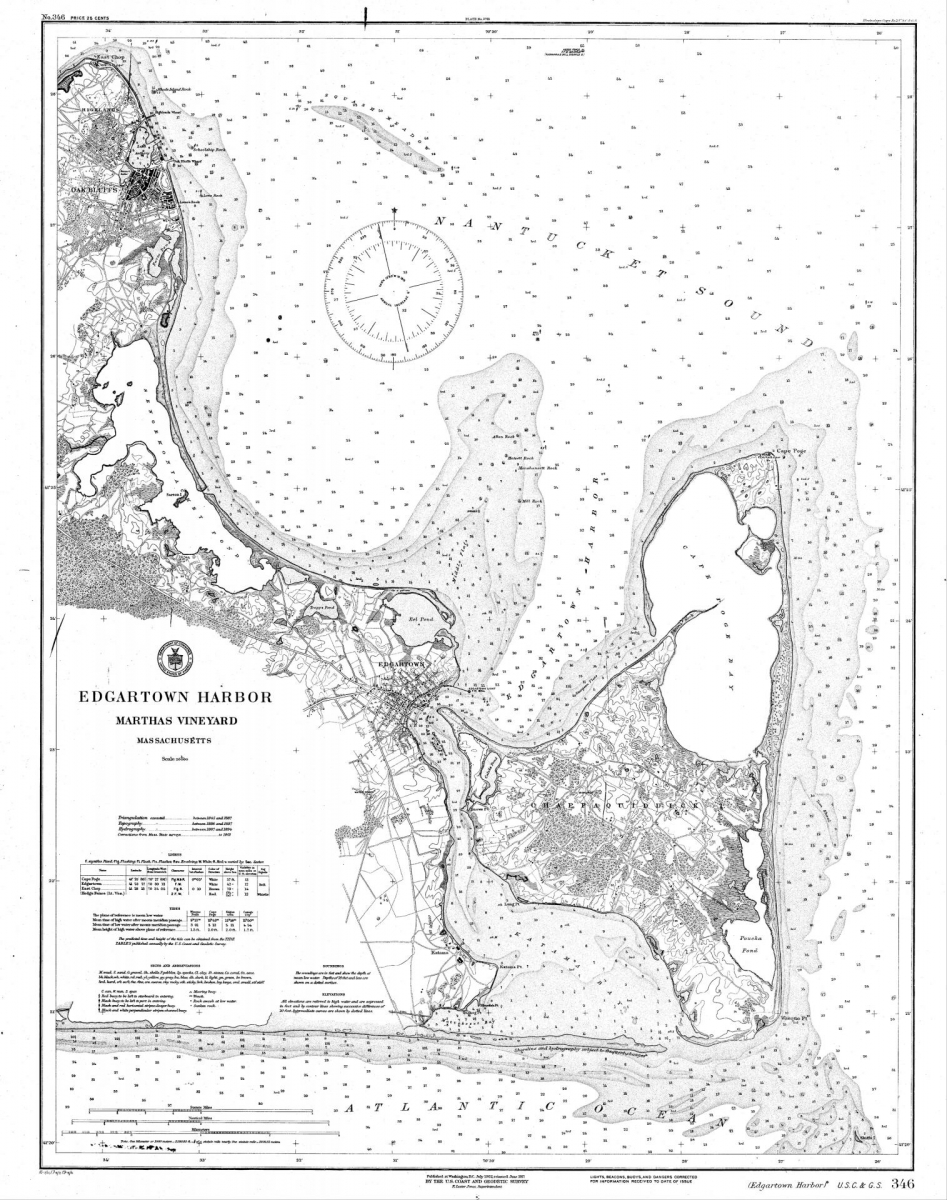 | 1887 U.S. Coast and Geodetic Survey. Edgartown Harbor.Source: NOAA Description the same as above. |
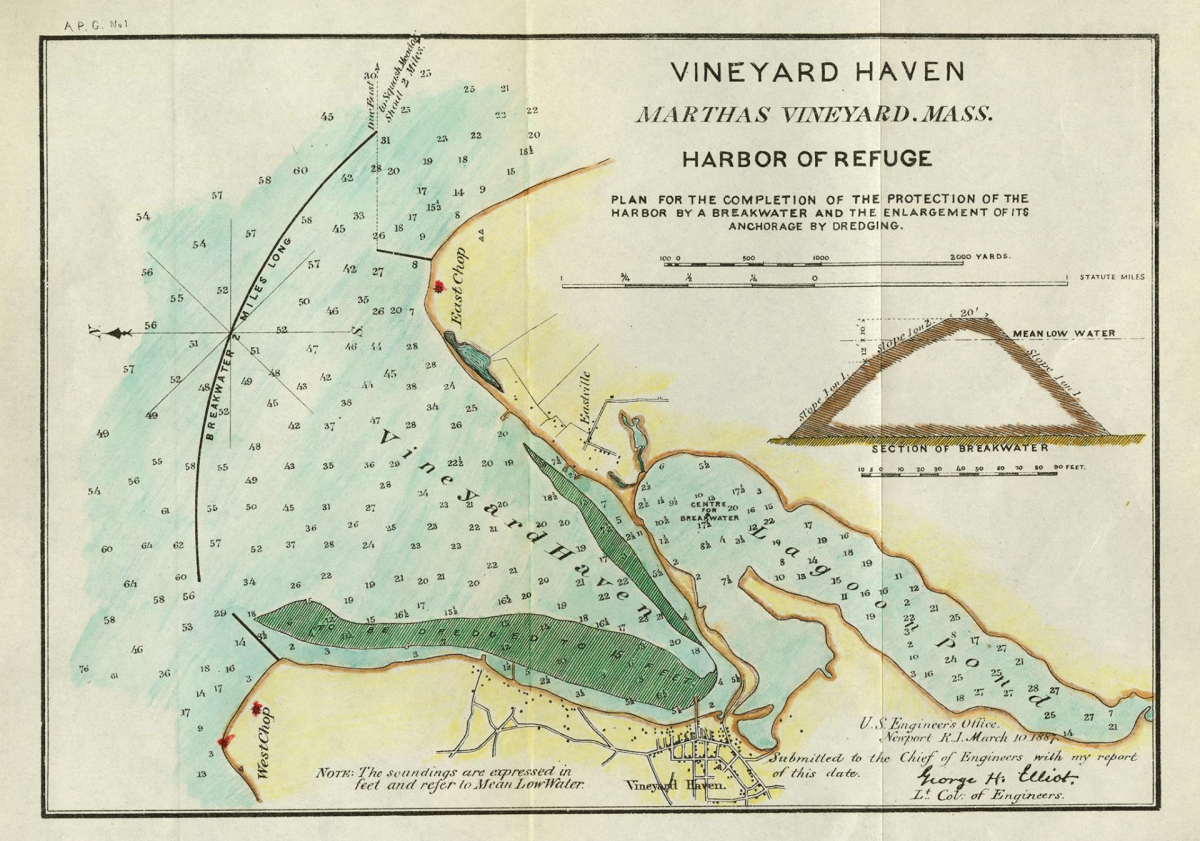 | 1887 U.S. Engineers Office. Vineyard Haven Harbor of Refuge.Source: Salem State University The critical weakness of Vineyard Haven as a secure harbor is its wide-open exposure to northern winds, like those associated with nor’easters, which can be among the most deadly storms at sea. As part of its regular operations the U.S. Army Corps of Engineers regularly took on assignments of evaluating proposals to build coastal protection and improve harbor, oftentimes generating detailed plans, costs estimates, and recommendations. In the case of this spectacular proposal to construct a 2-mile long breakwater across the mouth of Vineyard Harbor which was not approved. The declining traffic through Vineyard Sound and past the Island as well as the long-standing proposal to construct a canal across the base of Cape Cod did not justify the extraordinary expense. This and other versions of the map and plan are all that remain of a project that came too late and brought too little return to be pursued. Note the immense scale of the breakwater as depicted in the cross-sectional inset. |
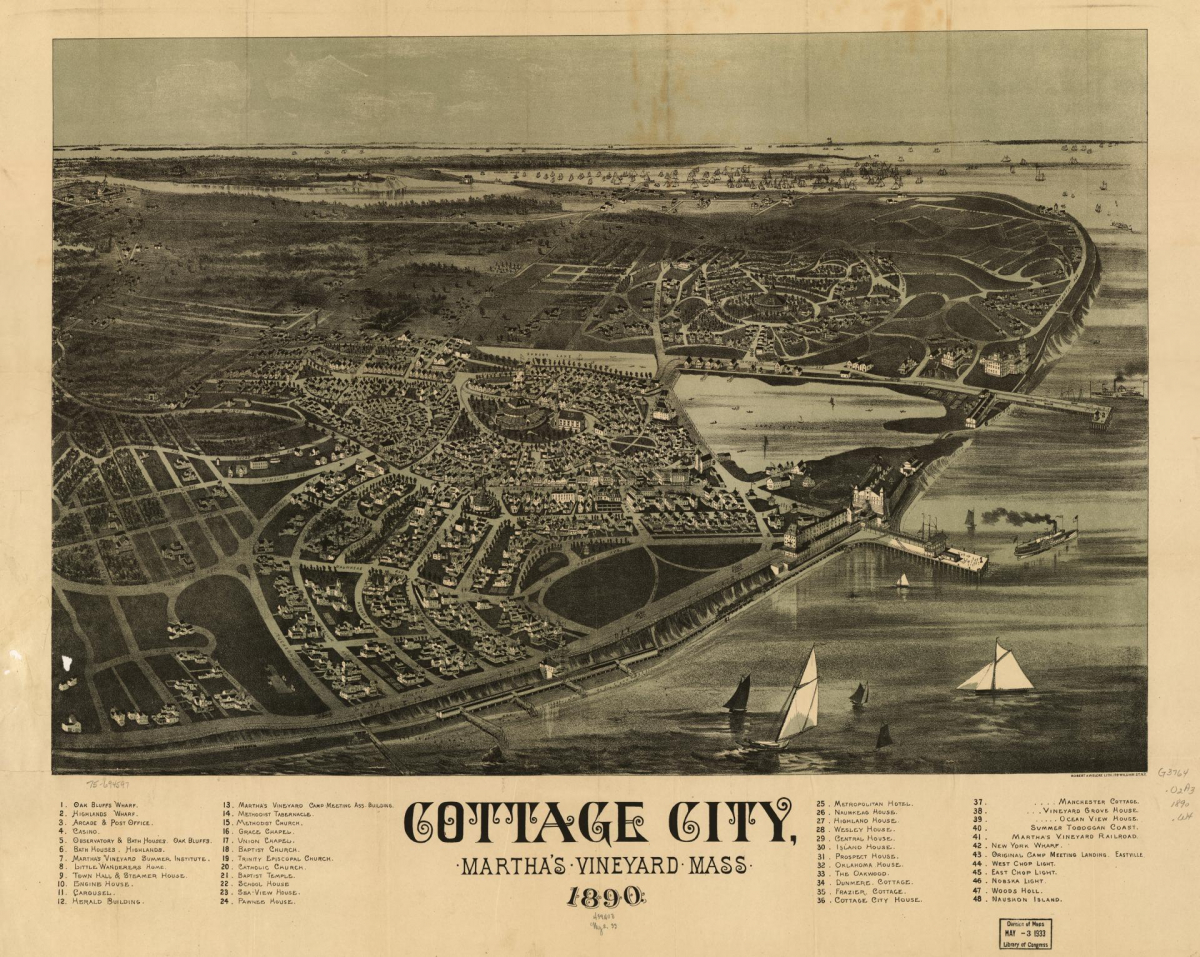 | 1890 Cottage City Birdseye View.Source: Library of Congress Other than the date this map is identical to that produced in 1887. |
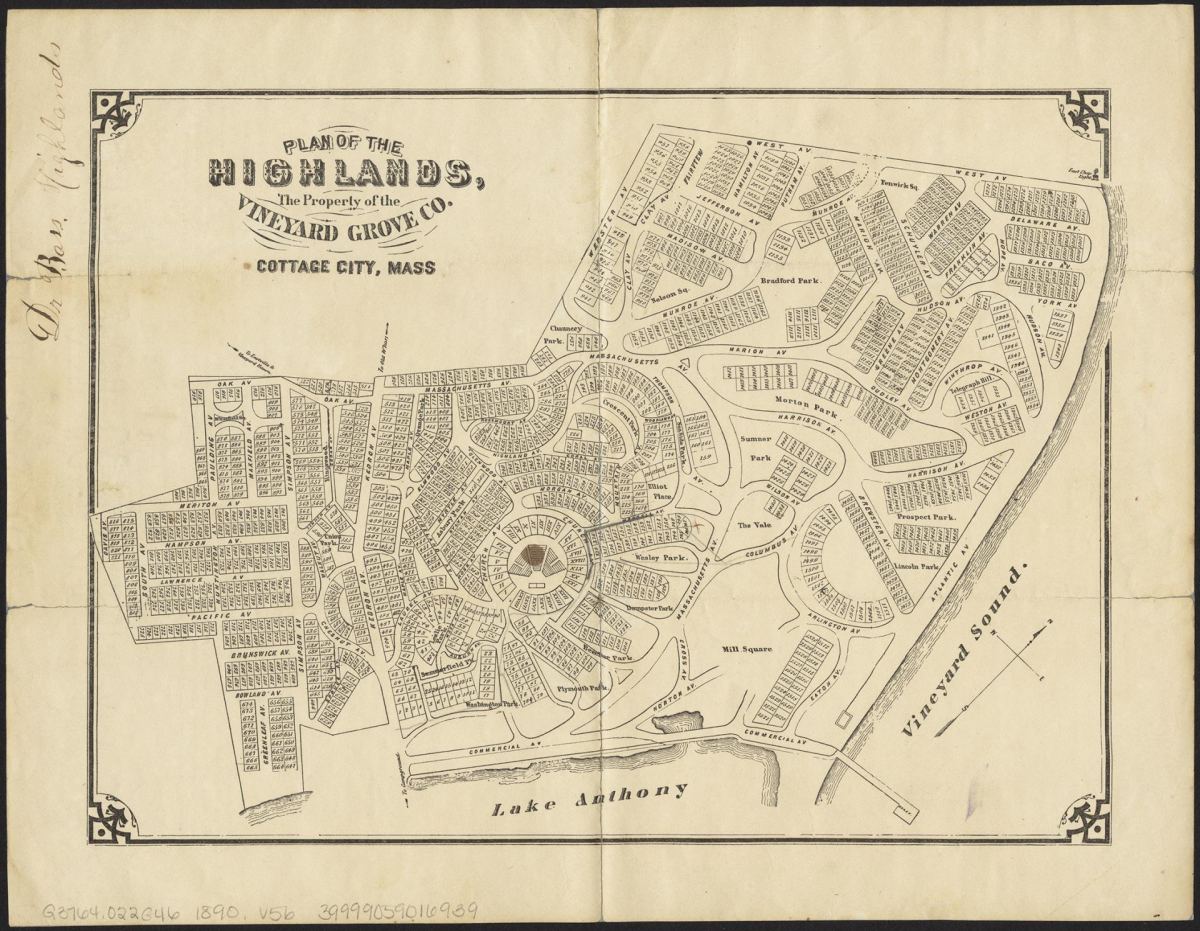 | 1890 Vineyard Grove Company. Plan of the Highlands, Cottage City.Source: Norman B. Leventhal Map Center at the Boston Public Library A plan for the Highlands showing the many parks spread through the otherwise densely packed neighborhood of some 1500 lots. The modern reality is a mixture of plan and alternatives. |
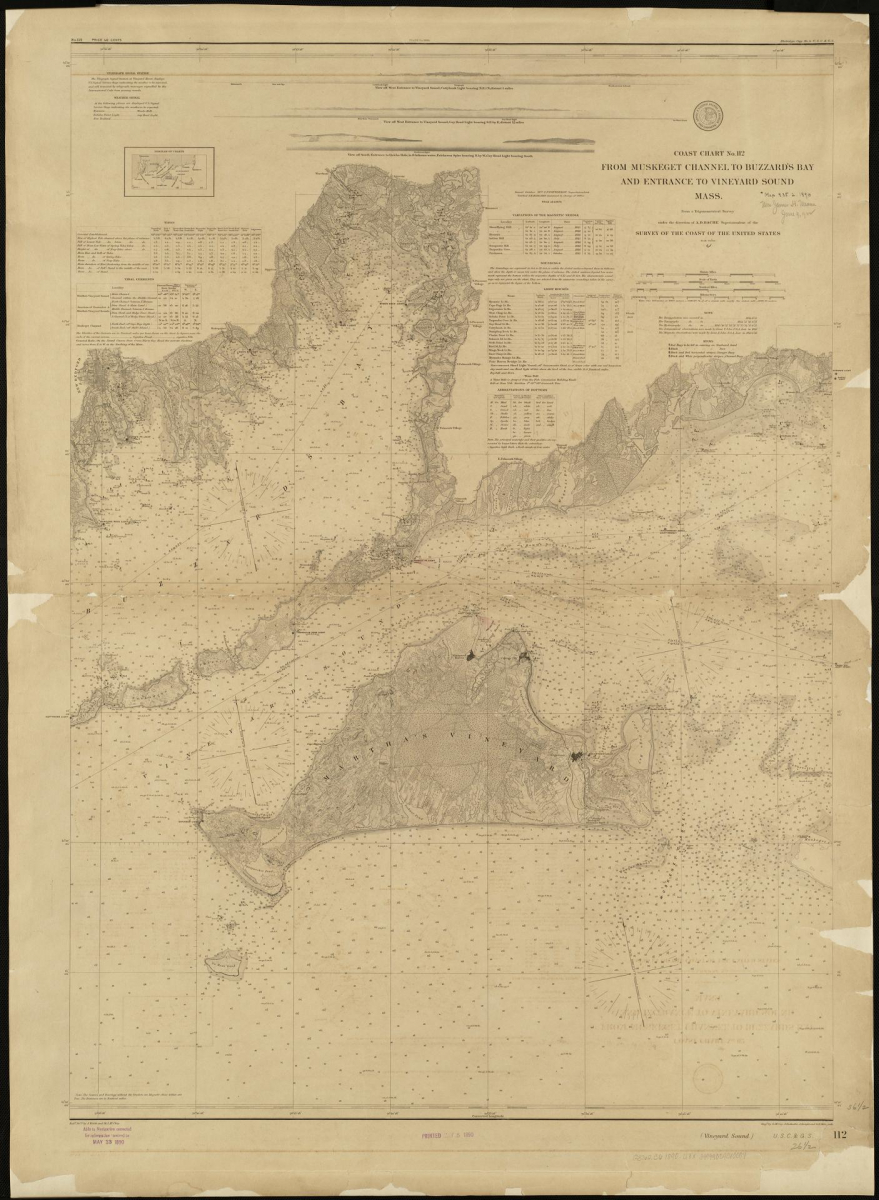 | 1890 U.S. Coast and Geodetic Survey. From Muskeget Channel to Buzzard’s Bay and Entrance to Vineyard Sound, Massachusetts.Source: NOAA; Norman B. Leventhal Map Center at the Boston Public Library Much of the data was collected three to five decades before publication. See 1861 and Whiting’s 1850 map. |
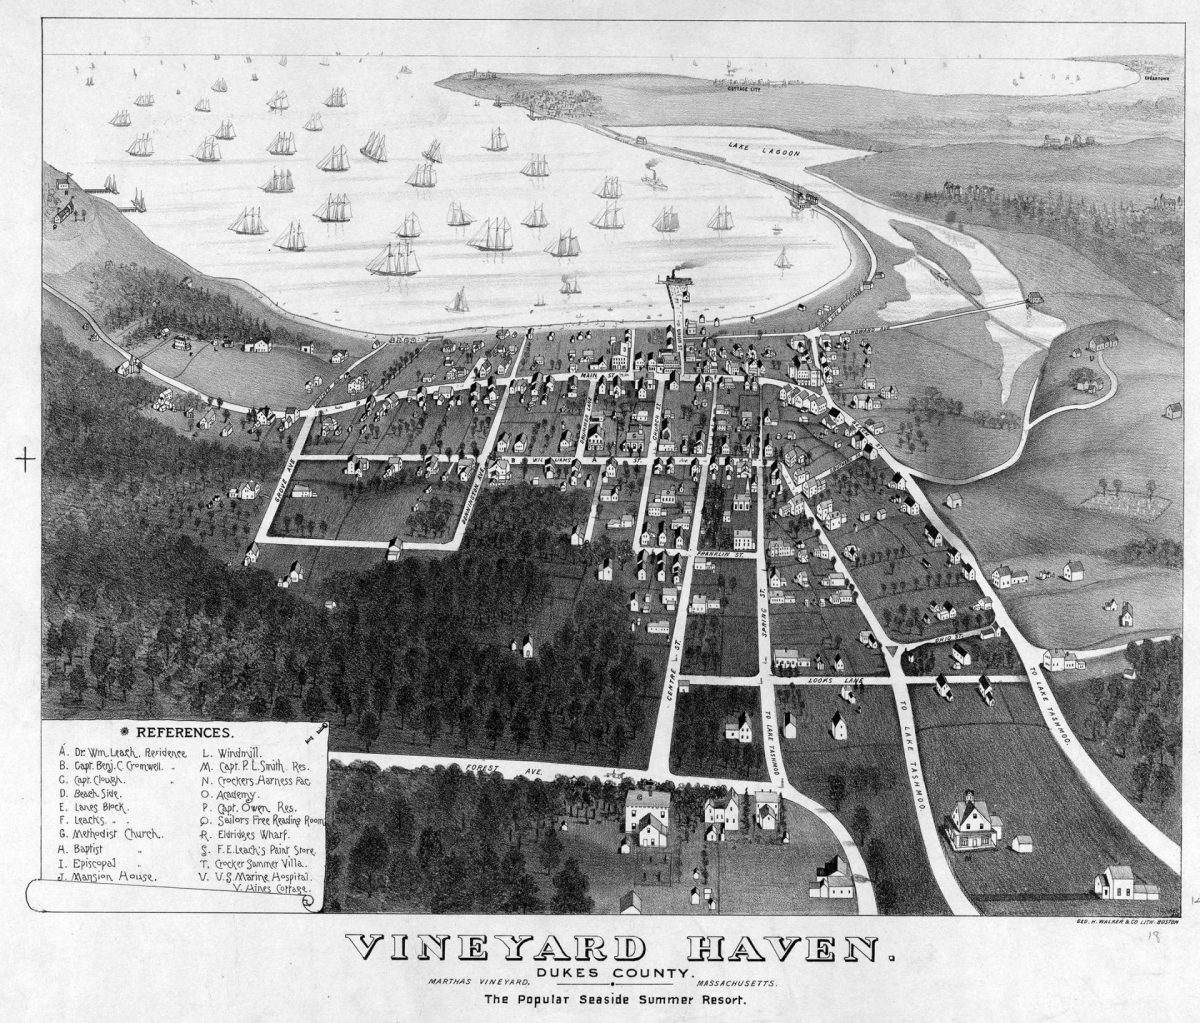 | 1890 Vineyard Haven Birdseye View.Source: Norman B. Leventhal Map Center at the Boston Public Library Among the striking aspects in this view are the extensive forested area at the outskirts of town, accessed by “Forest Avenue”; the large number of schooners, sailing boats, and steamships in the harbor; the distant concentrations of activity at Cottage City, the Highlands, and Eastville (which appears like a minor metropolis); and the fact that nearly all roads out of town to the west lead to Lake Tashmoo. |
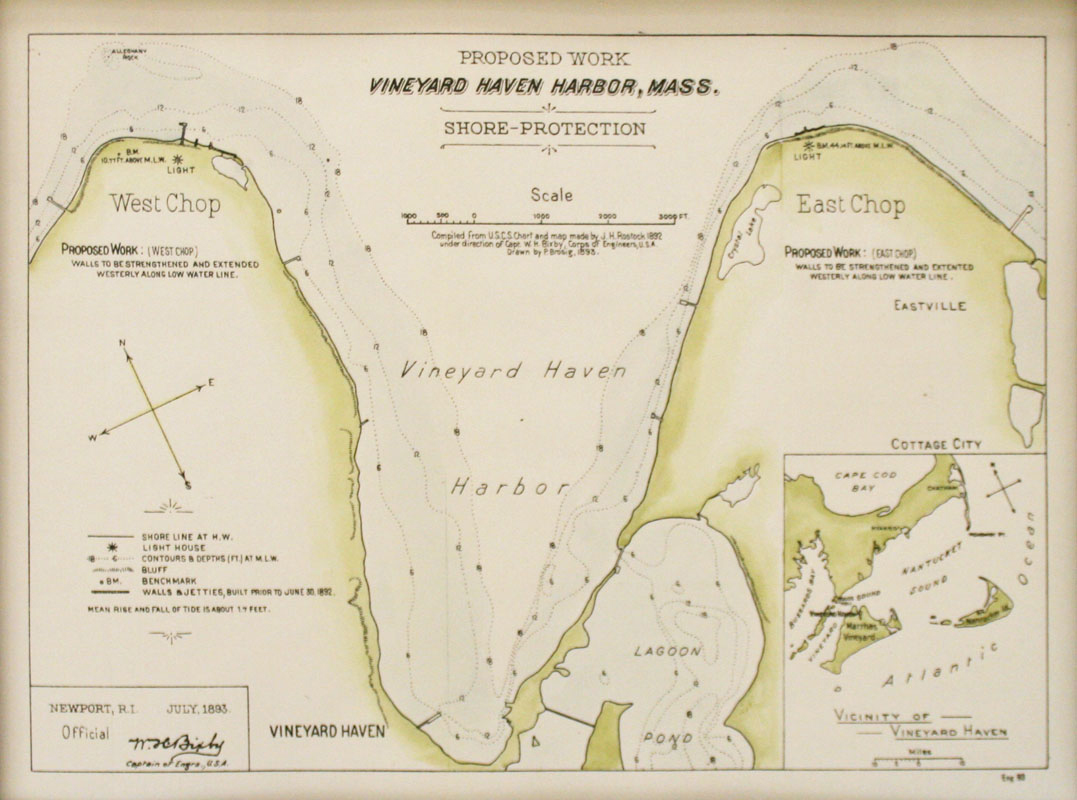 | 1893 US Engineers. East and West Chop Shore Protection with Vineyard Haven Harbor.Source: NOAA This plan by the U.S. Corps of Engineers laid out a proposal to strengthen the seawalls along the outer stretches of East and West Chops. The continual erosion at these locations had been measured by Henry Whiting and identified as a long-term threat as the southern recession of these headlands had the effect of decreasing the protected area of mooring within the harbor. This project was subsequently undertaken and effective shoreline protection was installed. |
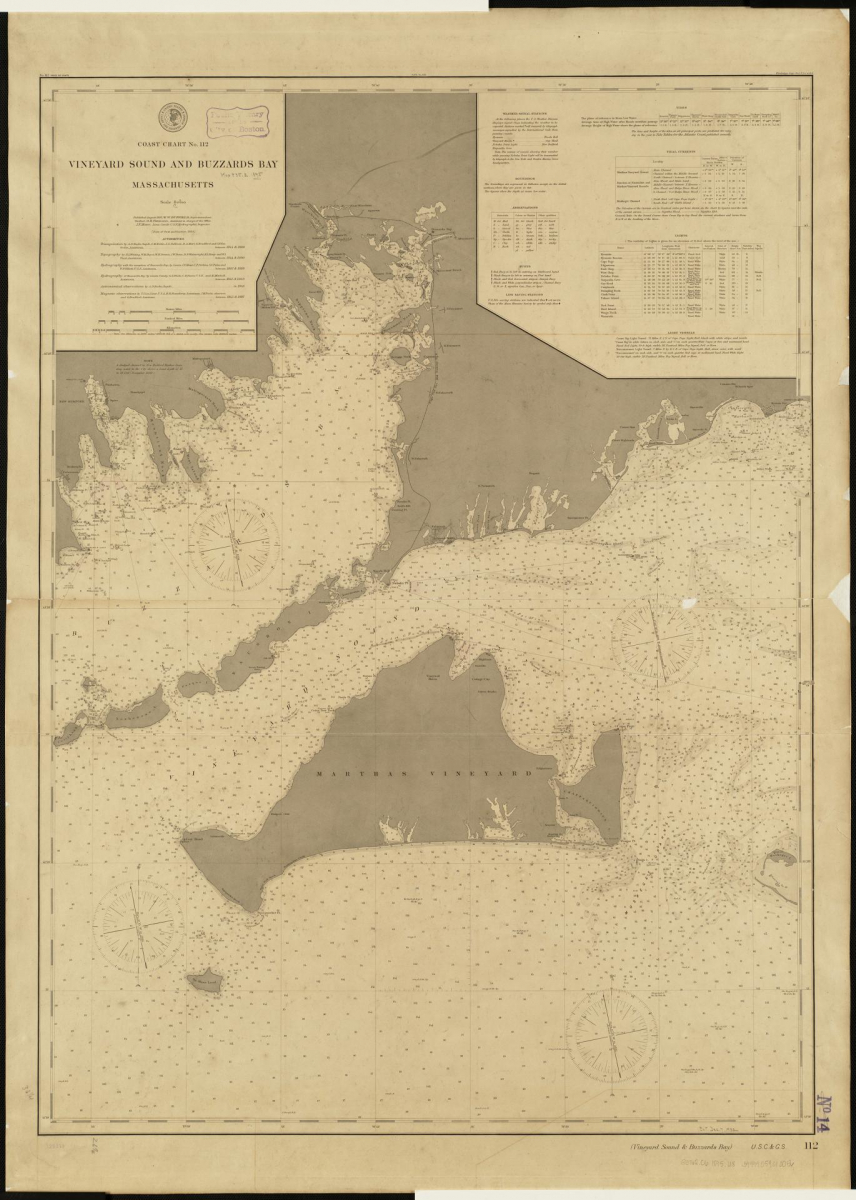 | 1895 US Coast and Geodetic Survey. Vineyard Sound and Buzzard’s Bay.Source: Norman B. Leventhal Map Center at the Boston Public Library An updated chart showing the waters and coastline of the Vineyard. Through time, the USCGS surveys become less and less concerned with features on land and tend to have more detail for mariners. |
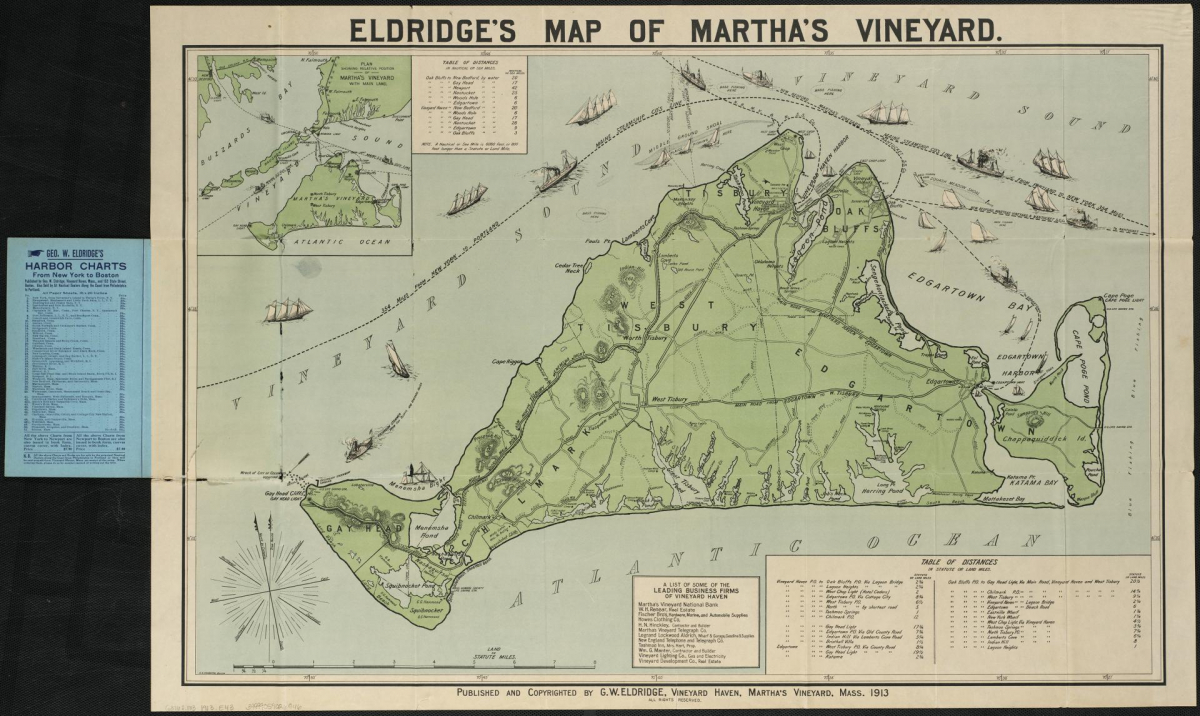 | 1913 Eldridge. Map of Martha’s Vineyard.Source: Norman B. Leventhal Map Center at the Boston Public Library The map by G.W. Eldridge is considered decorative rather than detailed and is sold as a reproduction in Vineyard shops today. In addition to main roads, regional ferry routes, and major sights, the map identifies the locations of a number of major landowners (e.g., Butler at Windy Gates, Hammond at Squibnocket), many south shore camps, and the location of various life saving stations. It has at least one glaring error: Duartes Pond is both mis-spelled and incorrectly located much further west of the head of Lagoon Pond than it occurs. Background on Eldridge and his related 1892 map are provided by Boston Rare Maps. The 1892 version provides a few names of the houses of local residents but omits the camps and large estates. “The map was published by G.W. Eldridge of Chatham, Mass. (1845-1914), the son and heir to the business of George Eldridge (1821-1900). The senior Eldridge produced his first chart (of the waters around Chatham) in 1851, and the firm bearing his name continued issuing charts until 1932, while the Eldridge Tide and Pilot Book remains in publication to this day. In contrast to the complex charts issued by the U.S. Coast Survey, Guthorn praises those issued by the Eldridges for their “good design, simplicity, and omission of extraneous shore topography, legible sounding and notes, and the use of compass courses only… Their loyal public; fishermen, coaster, tug masters, and yachtsmen, often continued to use obsolete Eldridge charts until the beginning of World War II.” (p.12) A second edition of the map appeared in 1913 with a number of changes and additions and is much more common than the first edition offered here. |
 | 1917 Wigglesworth. Map of Clay Pits on the western moraine of Martha’s Vineyard.Source: Edward Wigglesworth’s PhD thesis. 1914. The Geology of Martha’s Vineyard. PhD Thesis Harvard University. A photograph of a portion of a map from Wiglesworth’s PhD thesis at Harvard on the geology of Martha’s Vineyard. This map depicts the clay exposures that Wigglesworth located during his fieldwork and is interpreted by David R. Foster (and mapped in the book) as indicating the location of open pits where clay was dug for various industrial and commercial uses, presumably largely at the Paint Mill on Roaring Brook. As such, it is the only guide that the author is aware of to the location of clay pits, which were widespread on the western moraine. Black and white photographs from the thesis depict many of these pits in various states of use and vegetation regrowth when abandoned. After producing his classic study on the Vineyard with his mentor Professor J.B. Woodworth, Wigglesworth became the curator of the Gardener Collection of Photographs at Harvard and went on to become director of the Boston Museum of Natural History and President of the Gemological Institute of America. |
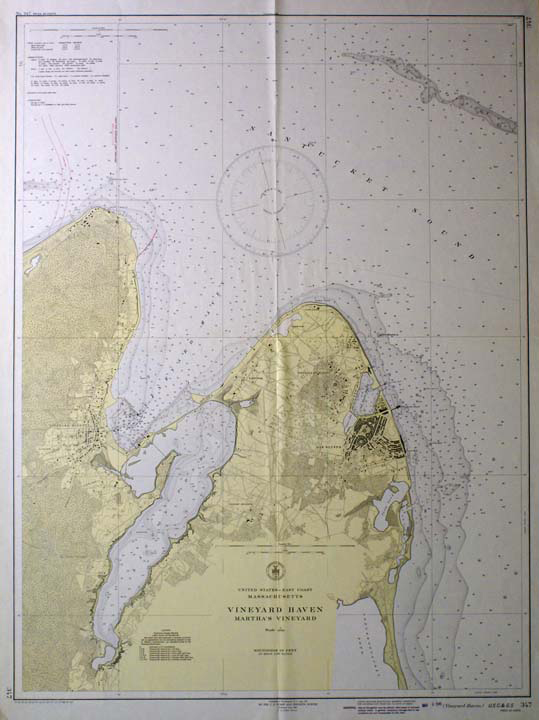 | 1937 U.S. Coast and Geodetic Survey. Vineyard Haven.Source: Martha’s Vineyard Museum A map made most interesting by the fact that it provides detail on the landscape in the late 1930s. This is a time when we also have the first aerial photographs available. Note the forested condition of West Chop. |
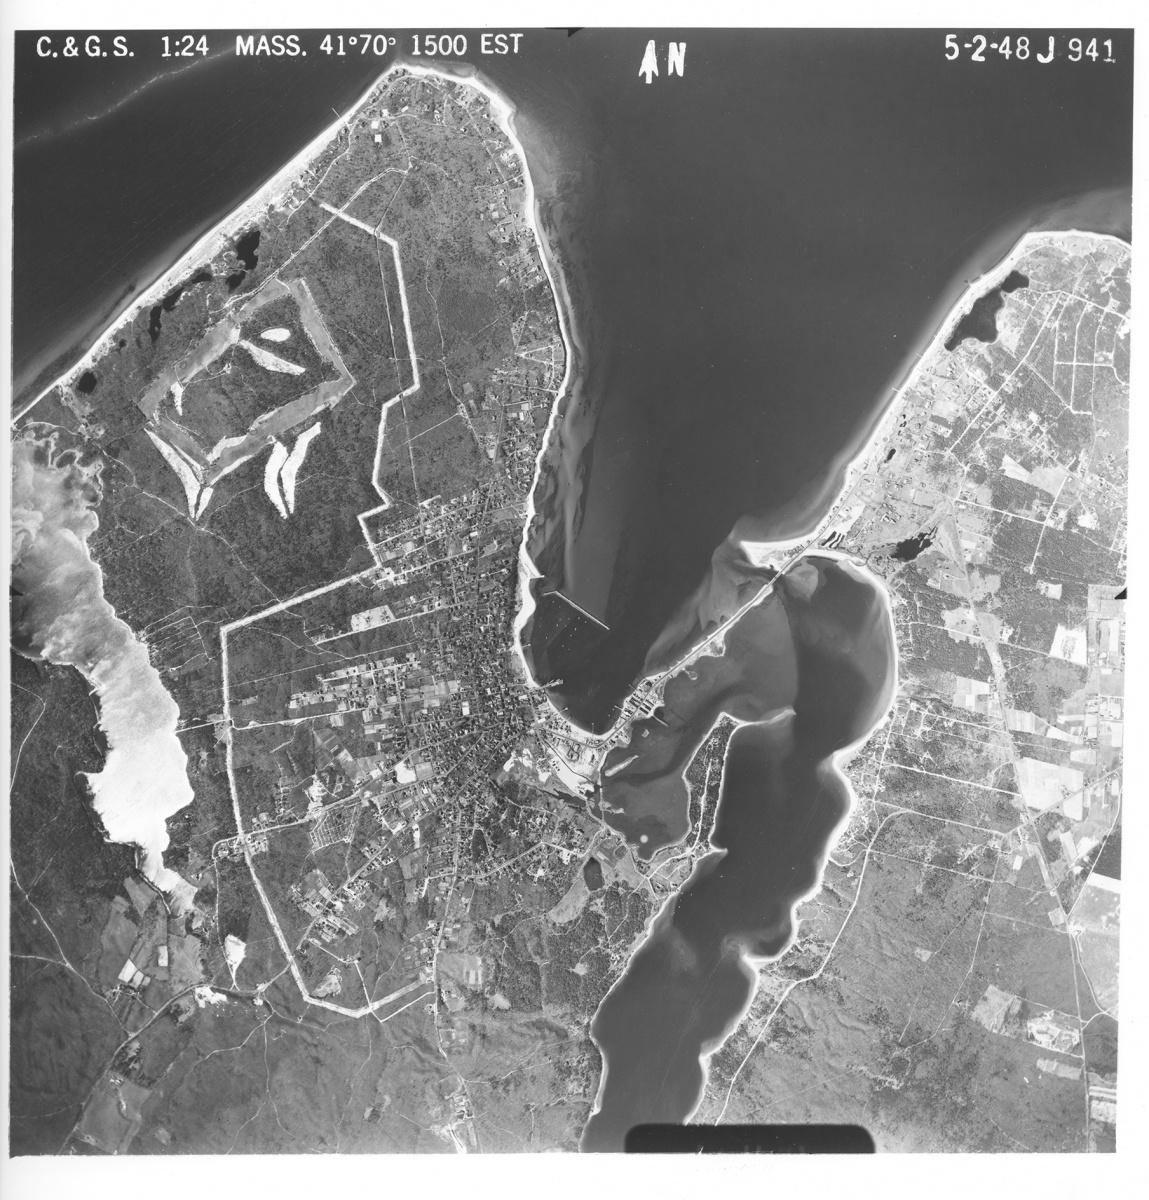 | 1948 Aerial Photographs of Vineyard Haven.Source: Harvard Forest Archive. Pete Ogden Collection These two photographs (1948 and 1955) were among Pete Ogden’s materials obtained from his daughter Karen Ogden and subsequently archived at the Harvard Forest where much of the material is available on-line through this web site. The photographs are notable in displaying the forested nature of West Chop and the early stages of land clearance and development for Mink Meadow Golf Course, the electrical transmission lines coming from Woods Hole, and housing. This photograph appears on page 192 of The Meeting of Land and Sea. |
 | 1955 Aerial Photographs of Vineyard Haven.Source: Harvard Forest Archive. Pete Ogden Collection These two photographs (1948 and 1955) were among Pete Ogden’s materials obtained from his daughter Karen Ogden and subsequently archived at the Harvard Forest where much of the material is available on-line through this web site. The photographs are notable in displaying the forested nature of West Chop and the early stages of land clearance and development for Mink Meadow Golf Course, the electrical transmission lines coming from Woods Hole, and housing. |
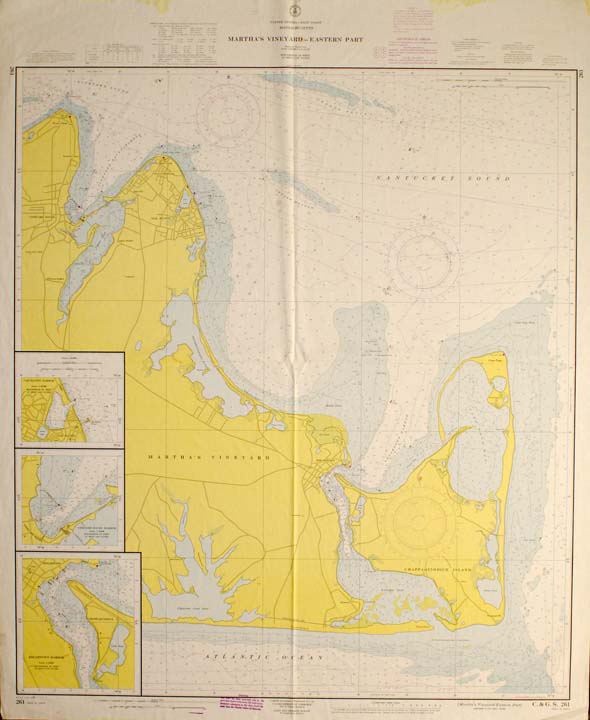 | 1961 U.S. Coast & Geodetic Survey. Eastern Martha’s Vineyard.Source: Martha’s Vineyard Museum A more modern chart depicting many features of the coast and off shore areas. |
