
You are here
Data is Eating Ecology: How We Make Sense of It
Marc Andreessen famously proclaimed that “software is eating the world,” and to me, data is certainly eating up ecology. Andreessen meant that software is fundamentally changing how companies and economies work, and that the incumbents will be taken over by software companies. Though not a direct analogy, data is changing ecology by impacting every stage of the scientific enterprise, from hypothesis formation to conclusion. This explosion of data comes from multiple sources, from the proliferation of cheap sensors to the better detail and scope of satellite coverage. This flood of data has brought many benefits, such as greater accuracy in measurements and the expansion of research, but it has also made it more difficult to assess the quality and validity of published information. Scientists, in order to turn raw data into usable information, may aggregate data from different contexts. They will also often perform a series of complex transformations, such as excluding outliers, extrapolating missing data, and generating random sequences. Without proper documentation of these processes with statistical software, other scientists can often find it impossible to reproduce and verify results.
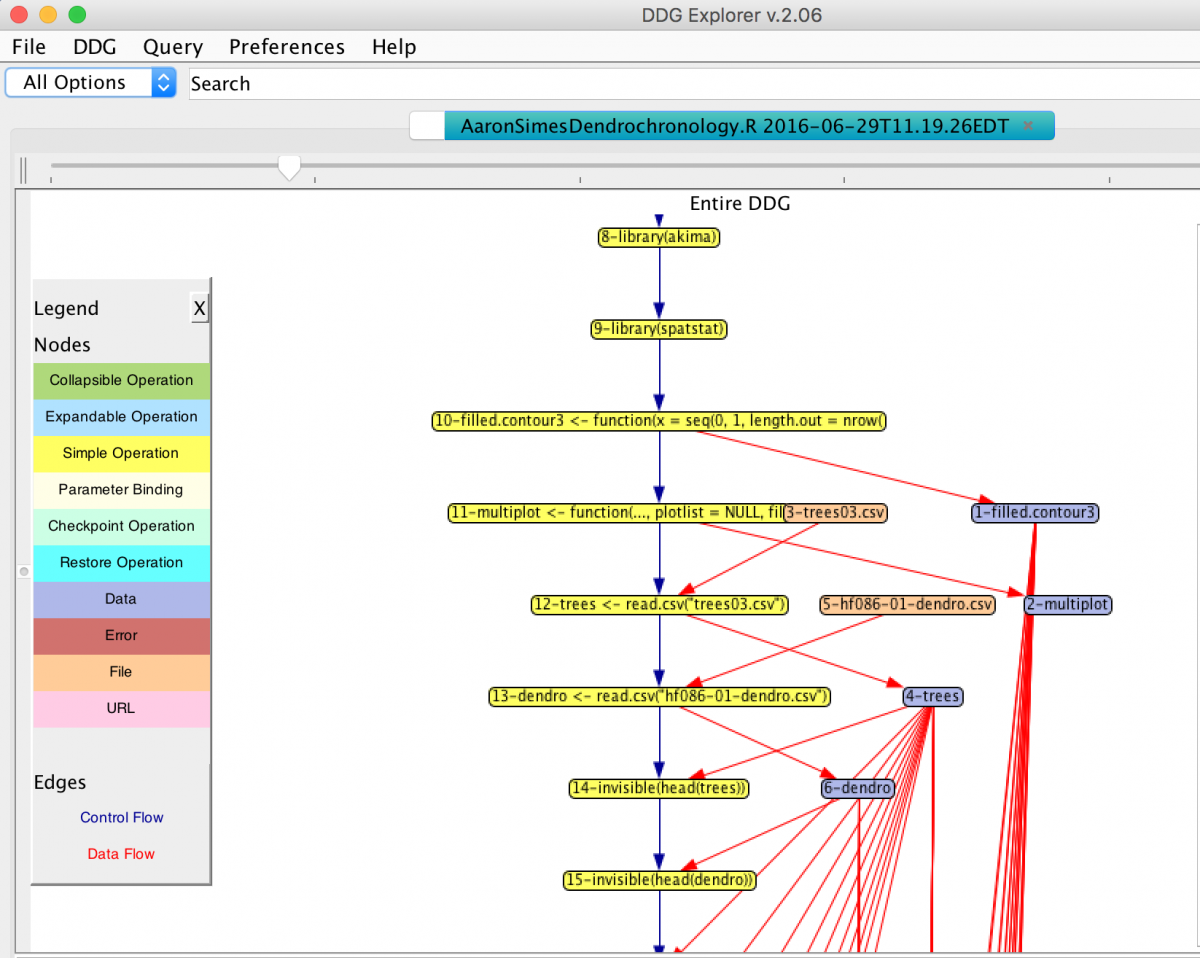
My mentors Barbara Lerner and Emery Boose are tackling this issue by developing a set of tools that can capture data transformation and history, or as it is more officially termed, data provenance. Our main focus right now is on the R language, which is the dominant programming language for statistical computing in ecology and many other fields. RDataTracker, our current tool for R, can automatically execute a R script (a program that can automate tasks) and generate a line-by-line visual representation of the code in a Data Derivation Graph, or DDG.
What I’m working on this summer is expanding the functionality of RDataTracker and making it more useful for scientists. My first project allowed RDataTracker to read in RMarkdown files, a file format that allows for easy formatting and publication of scripts. My next project is to save time for scientists who are changing re-running a program, by saving data that is already calculated and only recalculating parts that have been edited. Overall, we hope to make RDataTracker an easy and useful tool for scientists, so that capturing data provenance is not a burden but an asset.
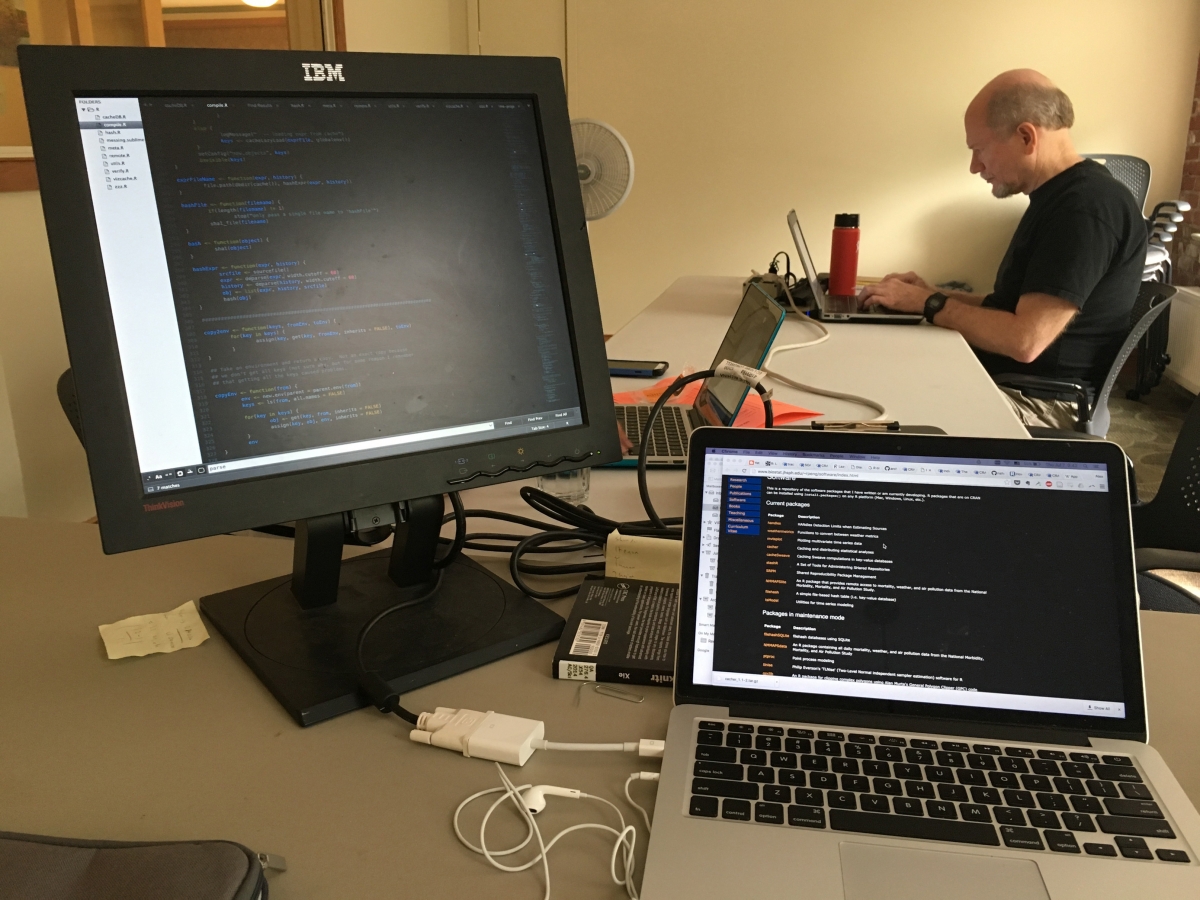
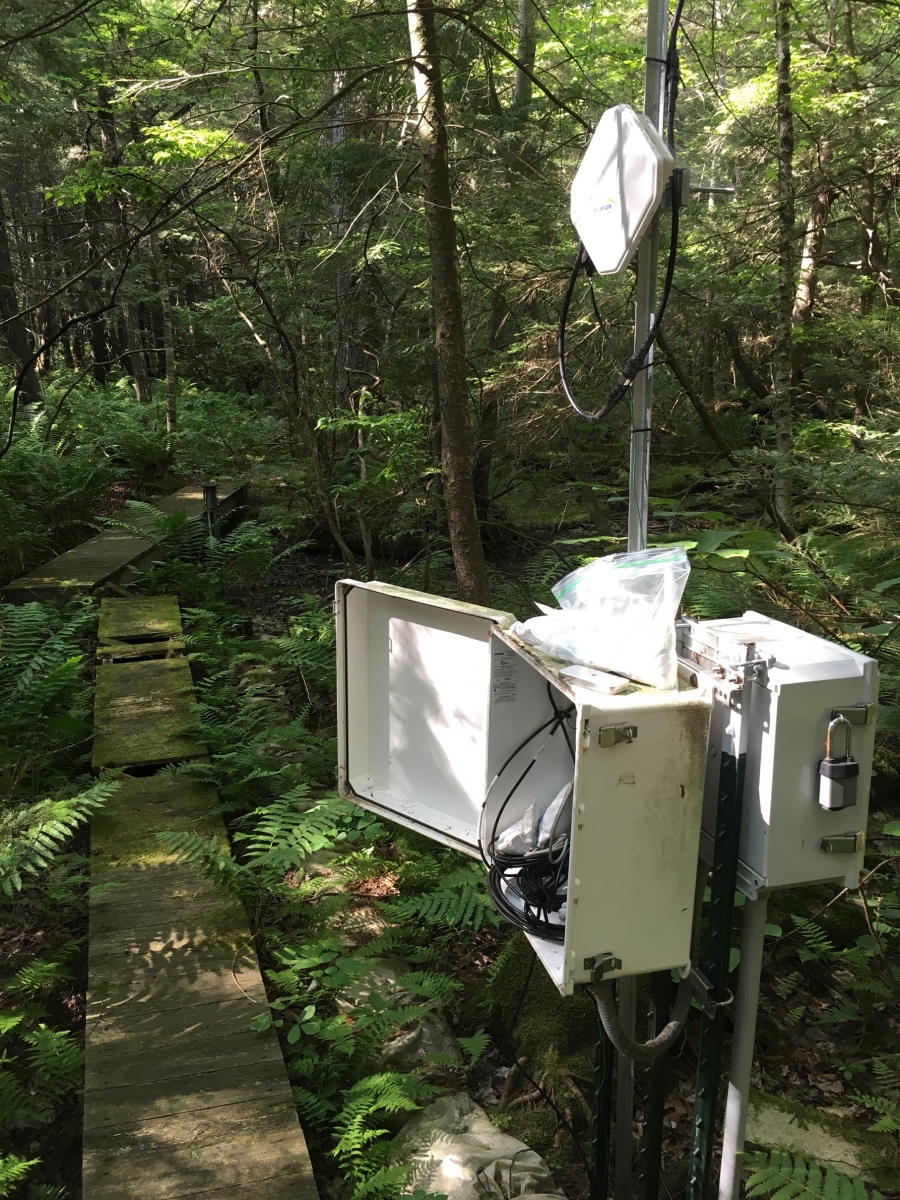
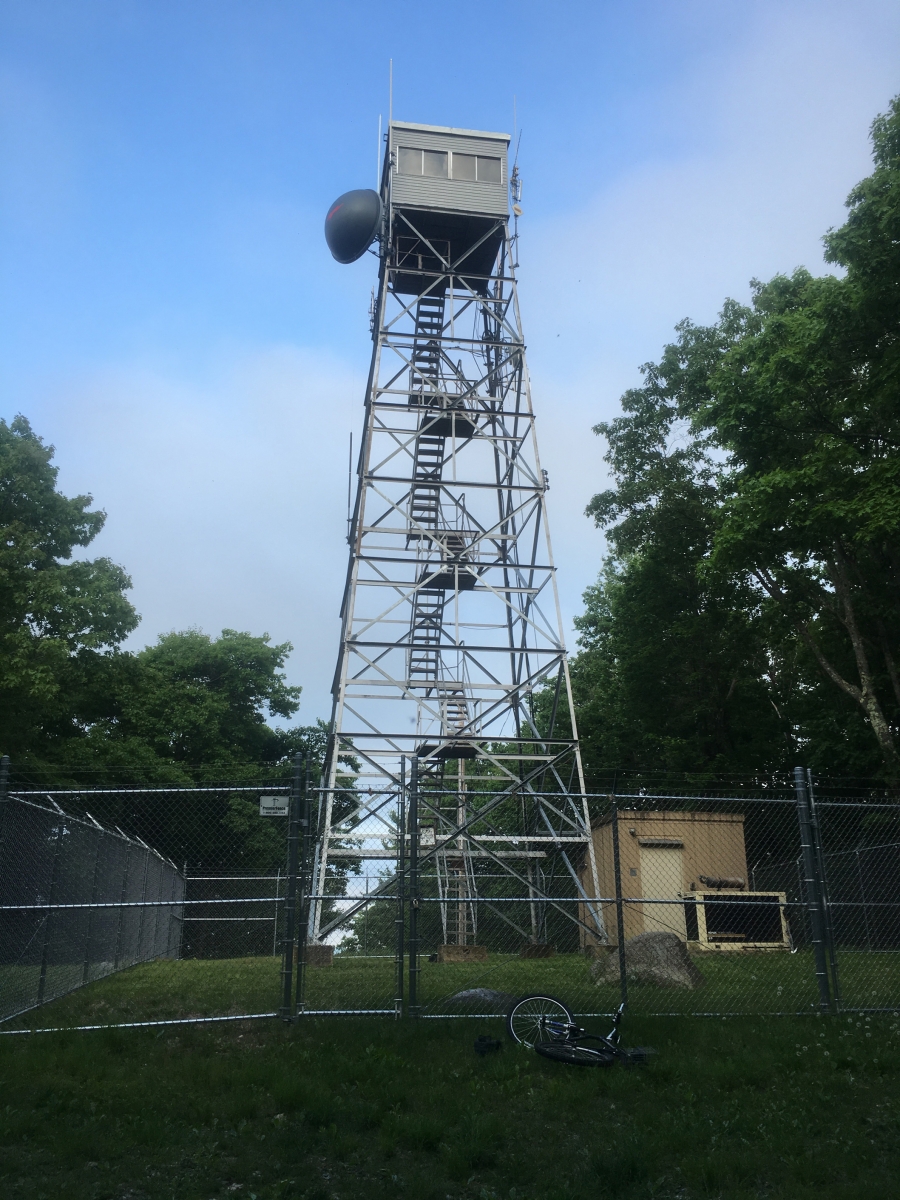 Most of my day is spent typing away at my computer in our new office, reading code and working out kinks. But this place isn’t called Harvard Forest for nothing. Every week I go out into the forest to check up on water height and flow sensors installed on the rivers and swamps throughout the woods. And after work, I’m free to run, bike, and explore. The fire tower on Prospect Hill has amazing views, and we also got the chance to climb trees with a visiting REU program. Weekends are also great, as we’ve had many activities organized by fellow summer program students, such as a trip to Acadia National Park, and there is almost always a car to Boston. Harvard Forest also provides bikes and helmets, and if you come to this program I highly encourage you to explore the local area, as Petersham and Athol definitely have the quintessential New England charm. I’ve even borrowed a bike to ride 30 miles to Amherst (where I go to school) and back.
As a final word, I’d like to say that Harvard Forest is an amazing combination of expansive wilderness with the amenities of modern life, but what truly makes the experience is the exceptional array of fellow students, mentors, and staff that make up the program.

