
You are here
Fun in a Warming Forest
 Let's play a word association game: Climate change.
Rising waters, acidifying oceans, species migration and extinction, extreme weather, and an ever-warming climate. Yes, all of these things and more. And while these are all of global concern, how about the impacts of climate change on a smaller, more regional level?
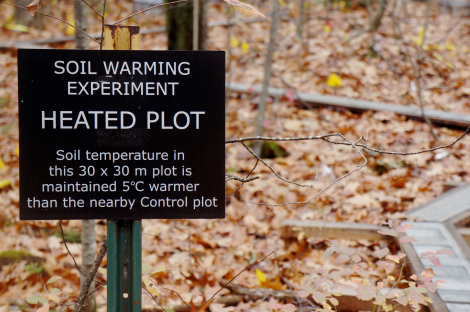
Here at Harvard Forest, we're asking exactly that. Currently, Harvard Forest has three soil warming experiments running, each of which has cables installed under the soil to warm the plots 5 degrees Celsius above ambient temperature in an attempt to measure how a warmer climate may impact New England hardwood forests.
Through routine measurements of gas fluxes, nutrient concentrations in the soil, and tree growth over more than a decade, Jerry Melillo and his crew have been able to put together a really interesting story, which can be summed up in a few bullet points:
- Warmer soils made for a more productive soil microbe community. This means that microbes were able to burn through soil organic matter – basically plant and animal matter in various stages of decomposing – and release a surplus of nutrients into the surrounding soil.
- In particular, the breakdown of soil organic matter led to a huge spike in nitrogen availability. Because nitrogen is typically seen as a limiting nutrient in these ecosystems, having an abundance of free nitrogen meant that the trees in the heated plots were able to grow at a faster rate and store more woody biomass in comparison to the control plot.
- Once nitrogen was freely available, trees stopped investing as much energy and carbon into forming fine root systems. Seeing as many species of fungi colonize fine root biomass by forming a sheath over the root tip, decreasing the number of fine roots also has the potential to impact root tip colonization.
While these trends held up for the first 10 years of the experiment, in the past two years, one aspect has noticeably changed: the trees. Their growth spurt has come to an end.
And this is a really interesting observation, as it indicates that nitrogen might not be the only limiting factor in this ecosystem anymore. Perhaps the decade of soil heating has desynchronized nutrient cycles or depleted the system of another critical nutrient. And we're hedging our bets on phosphorus.
To test out our hypothesis, my time at Harvard Forest has been a whirlwind of different experiments and approaches that aim to tackle this from as many angles as possible.
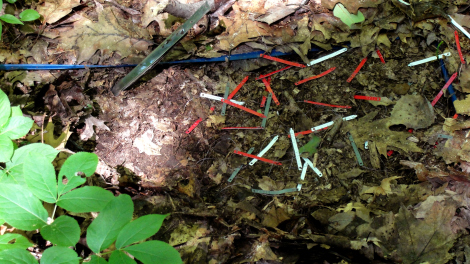 We kicked off the summer by trying to determine exactly how much phosphate was readily available in the soil. To do this, we prepared ion-exchange membranes – which essentially mimic root behavior and suck up nutrients in the soil – and deployed them in Barre Woods. Once they were all safely snuggled in the soil, we covered them up with leaf litter and tucked them in for a nice two-week nap so that they could collect phosphate.
After their incubation time was up, we extracted them to determine phosphate content. While we have this initial set of data, we've actually deployed another set (that are in the soil as we speak!) that we hope will reduce variability and show us if soil warming has a significant effect on phosphate availability.
But phosphate isn't the only form that phosphorus can take in the soil. Specifically, it can buddy up with other elements, like metals oxides or calcium, which bars plants and the itty-bitty microorganisms that live in the soil from accessing it. The cool thing is that we can measure exactly how large these pools of phosphorus are by sequentially extracting the soil. What this means is that we add a series of chemicals to the soil, extract the solution they produce, and measure the concentration of phosphorus in that fraction. From there, we should be able to figure out if phosphorus is stored differently under warming conditions.
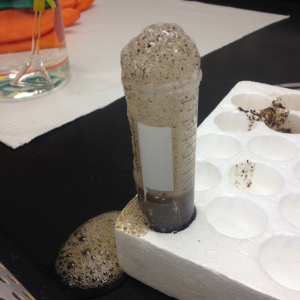 The only problem with this is that in order to get at the super recalcitrant phosphorus, we have to use super corrosive chemicals. Hence, the finale of extractions involved crazy concentrated hydrochloric acid, which caused our samples to froth up like one of those second grade school volcanoes kids make with baking soda and vinegar.
And while we're interested in the phosphorus content of the soil, we're also want to learn more about the enzyme that free up phosphate from organic matter – phosphatase. Both fungi and soil microbes produce phosphatase, and we think that the demand for enzyme production might be directly correlated to how much free phosphate is already in the soil. To test for enzyme activity, you mix soil with a buffer to make a soil slurry, and then you add in a whole cocktail of different enzymatic substrate that fluoresce when they're broken apart.
Since we were going all of the prep work to test for one enzyme, we decided to throw a few other key players into the mix, so we'll also have data on enzymes that make nitrogen and simple sugars available as well as a few that are involved with the oxidation of organic matter.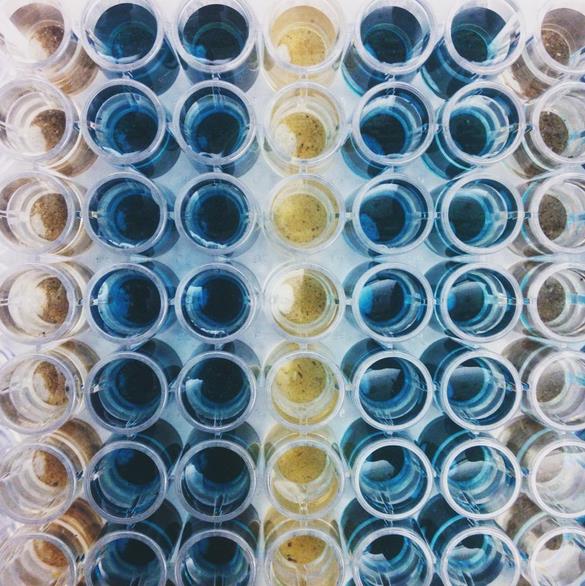
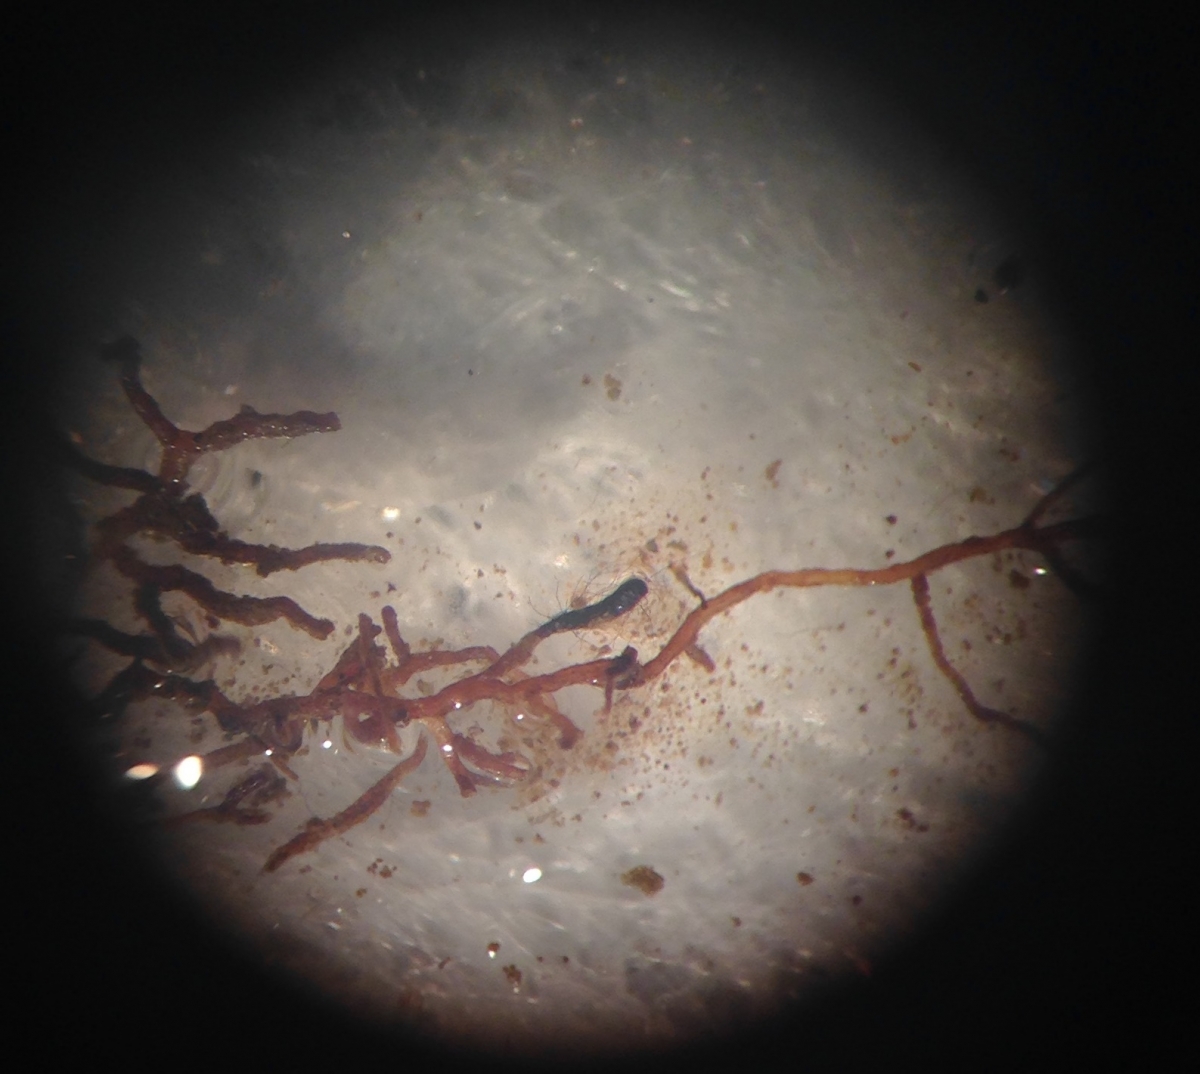
But, not all ectomycorrhiza are created equal. Some of them form a smooth interface on the very tip of the root while others produce hyphae that extend out into the soil. Based on the general appearance of the ectomycorrhiza, we can classify them into having different explorative strategies – contact, short, medium, and long-range distance. And we want to know if the surplus of available nutrients has had any kind of impact on the kind of ectomycorrhiza or explorative strategies that are favored in the heated plot.
To figure this out, I spent a week in lab with my eyes glued to a microscope trying to determine root tip colonization rates and putting together morphological descriptions of the different ectomycorrhiza I encountered. I then sliced and diced all of these root tips from their mother branch and packed them away on my trip up North to the University of New Hampshire to visit Serita Frey and Linda van Diepen at the Soil Microbial Ecology Lab.
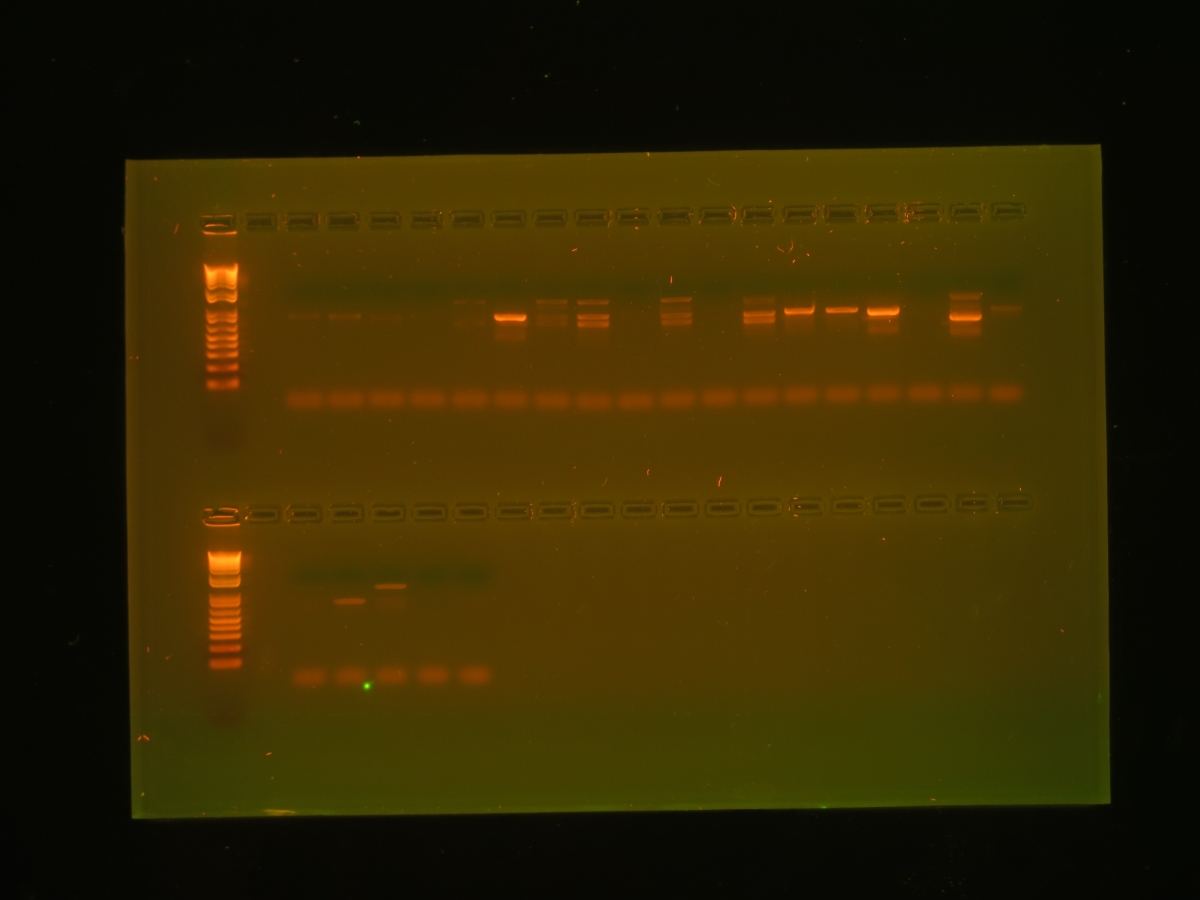
Here, I extracted DNA from these root tips and amplified it to quantities we could measure. In the gel below, each time you see a band, it indicates that we were successful in our attempt to isolate and amplify the DNA. Once we had this confirmation, we sent the DNA out for sequencing, and within 24 hours, we had a text file sitting in our e-mail filled to the brim with genetic code.
That about wraps up where we are so far in my project. And while it's been a whirlwind of different experiments, with three weeks left to go we still have a heck of a lot of data crunching and statistics to run to see if any of our results have any real significance!
If you're interested in following along with the rest of my adventures here this summer and how this project plays out, I also keep a science blog, which you can find here: https://environmentalbrigade.wordpress.com/.
