You are here
Debugging Ecological Research
![[The types of bugs most ecologists expect to see.]](/sites/default/files/reu/bug%20in%20had_flipped.jpg) With ecology, as with an increasing number of other fields, "big data" has become an intrinsic aspect of scientific research. Ask most field scientists and, with a grunt of disapproval mixed with displeasure, you are likely to hear about all the programming and statistical analysis that has to be done to gain meaningful results. Consider the inevitable sensor drift that occurs and the recalibration that must take place to restore validity to the data; or, imagine a flash flood, lighting strike, or simple technical failure that can lead to incorrect or unavailable sensor readings. As larger sets of raw data become necessary to understand the complex systems scientist study, these issues will only grow in number. Tools and methods currently exist to compensate for these failures of the raw data, but they are varied, diverse, and rarely described in detail on the final published paper. That lack of information combined with the complex quality control measures scientists use leads to a severe weakening of one of science's fundamental tenants – reproducibility.
With ecology, as with an increasing number of other fields, "big data" has become an intrinsic aspect of scientific research. Ask most field scientists and, with a grunt of disapproval mixed with displeasure, you are likely to hear about all the programming and statistical analysis that has to be done to gain meaningful results. Consider the inevitable sensor drift that occurs and the recalibration that must take place to restore validity to the data; or, imagine a flash flood, lighting strike, or simple technical failure that can lead to incorrect or unavailable sensor readings. As larger sets of raw data become necessary to understand the complex systems scientist study, these issues will only grow in number. Tools and methods currently exist to compensate for these failures of the raw data, but they are varied, diverse, and rarely described in detail on the final published paper. That lack of information combined with the complex quality control measures scientists use leads to a severe weakening of one of science's fundamental tenants – reproducibility.
![[A snippet of a DDG as well as intermediate data generated by the script.]](/sites/default/files/reu/DDG_cropped2.jpg)
This summer, I will be working with Dr. Emery Boose and Prof. Barbara Lerner on a software library, RDataTracker, whose purpose is to collect the data provenance and form a Data Derivation Graph (DDG) with the goal of improving research reproducibility. Wow! What is that you just said? Data deri-what? When scientists manipulate data, the data transformation usually occurs sequentially. The data provenance is a record of those transformations – a history of the data, from start (raw data) to finish (published results). A DDG is a visual representation of these historical paths. Our DDGs are little more than a set of labeled nodes with input data and output data connected by pointed arrows indicating the direction of data travel.
![[Code written by an ecologist to analyze their data in R.]](/sites/default/files/reu/Rcode_cropped.jpg)
As the name indicates, RDataTracker is a library, or collection of commands and functions, written in the scripting language R. R is increasingly the language and software of choice among ecologists for the analysis and manipulation of data. Most of my work this summer will focus on improving the usability of the library through two main processes: (1) automating data collection and (2) studying real world uses. Automating the data gathering for DDG creation will not only improve the usability of the library by reducing the number of additional lines of code researchers must add to their scripts, but will also hopefully prevent the creation of erroneous DDGs. We hope that by working with real-world scripts we will mold the library into an effective, easy to use tool that eventually becomes second nature to scientists. I plan to speak directly with scientists about their uses for R to gather information on how RDataTracker can become a natural part of data analysis.
![[A software bug raising an error message in the generated DDG.]](/sites/default/files/reu/DDG%20bug_cropped_0.jpg)
![[From left to right: Maru, Lily, and Nikki. The three are enjoying the more relaxing aspects of the REU.]](/sites/default/files/reu/Maru%20Lily%20and%20Nikki_cropped.jpg) While most of the work will involve the indoors, we have planned trips out into the beautiful Harvard Forest to directly collect data from sensors. In fact, today is our first trip! Not only that, but as part of the REU program, I have already made myself acquainted with Amherst, Petersham, and the surrounding areas. This summer will likely be one of the most exciting so far, from software bugs to real world bugs! To put it into perspective, the discussions with my roommates have ranged from cross-country driving to black hole radiation and quantum tunneling in semi-conductors. Two weeks have not even yet passed!
While most of the work will involve the indoors, we have planned trips out into the beautiful Harvard Forest to directly collect data from sensors. In fact, today is our first trip! Not only that, but as part of the REU program, I have already made myself acquainted with Amherst, Petersham, and the surrounding areas. This summer will likely be one of the most exciting so far, from software bugs to real world bugs! To put it into perspective, the discussions with my roommates have ranged from cross-country driving to black hole radiation and quantum tunneling in semi-conductors. Two weeks have not even yet passed!
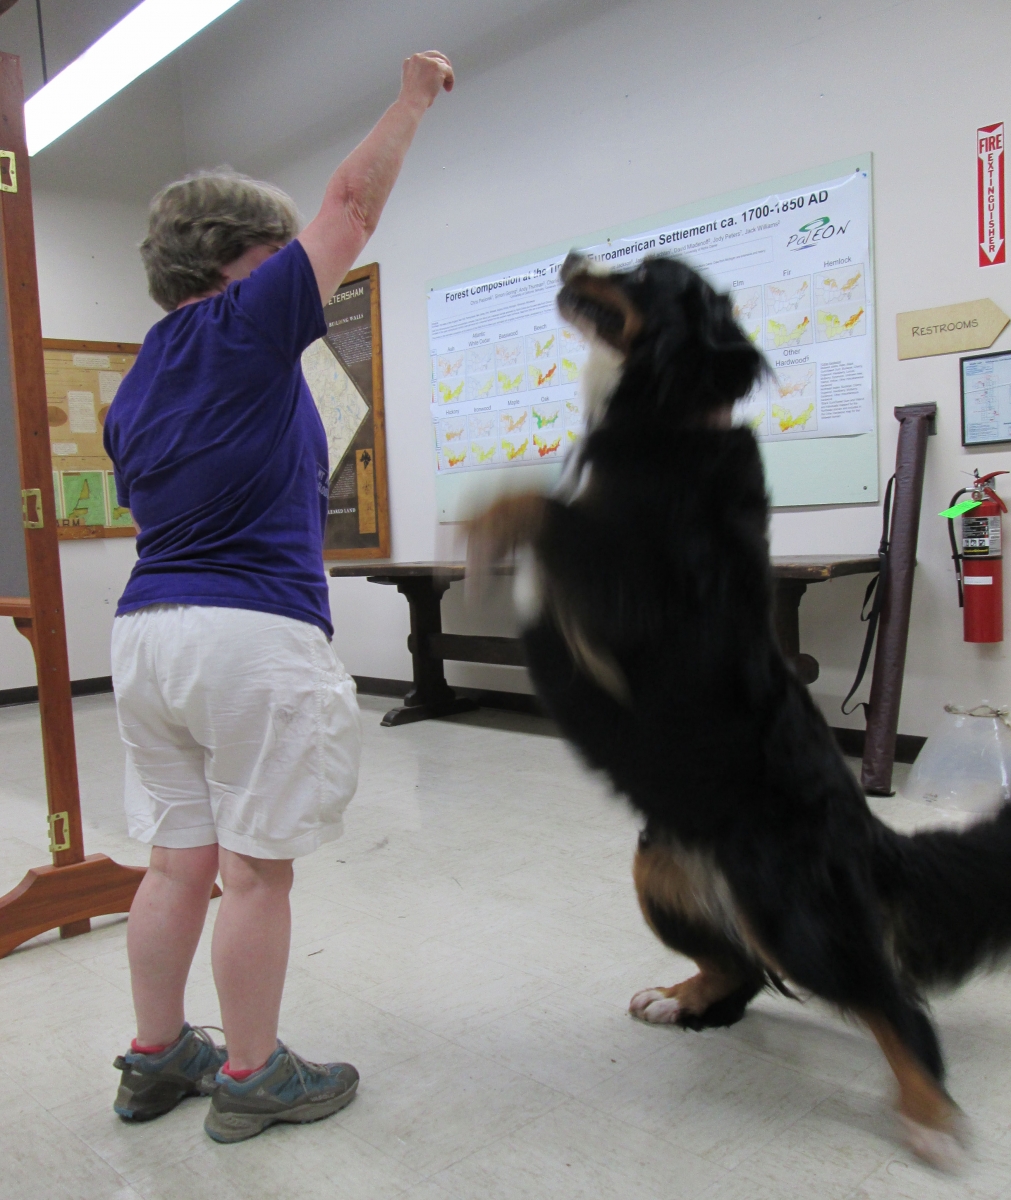
PS: We also have a mascot, Snickers. Yep, she is an active, thinking, and writing dog!
![[Barbara Lerner and Snickers showing off Snicker's tricks.]](/sites/default/files/reu/Snickers_cropped.jpg)


