You are here
The adventures of taco
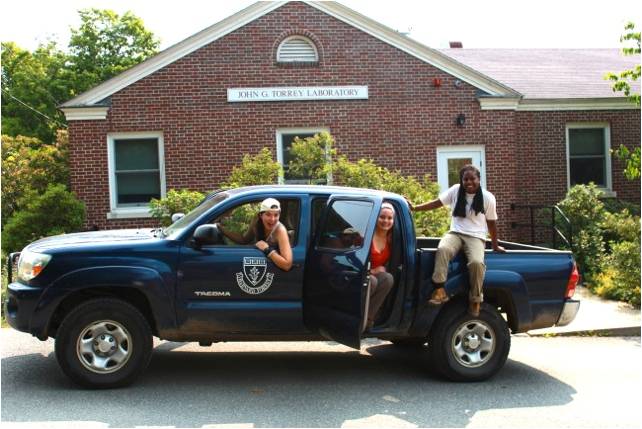
Our first task for our summer project was a giant scavenger hunt throughout the whole forest: find our 100 plots, where we were to take measurements throughout the summer. Armed with our Tacoma, also known as Taco, a GPS unit, a map, and three bug jackets, we began our search.
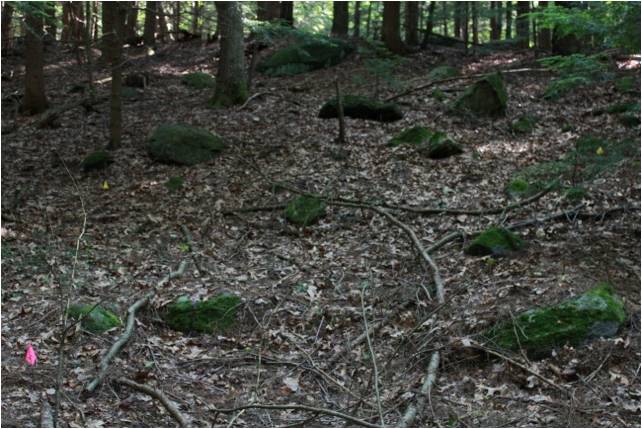
![[Adalyn on the left, Candice in the middle, and Margaret on the right.]](/sites/default/files/REU_Taco1_2013.jpg) Our plots consist of three short but wide pieces of PVC pipe, called collars, which are each marked by a flag. Here’s a shot of one of our plots—can you find the flags?
Our plots consist of three short but wide pieces of PVC pipe, called collars, which are each marked by a flag. Here’s a shot of one of our plots—can you find the flags?
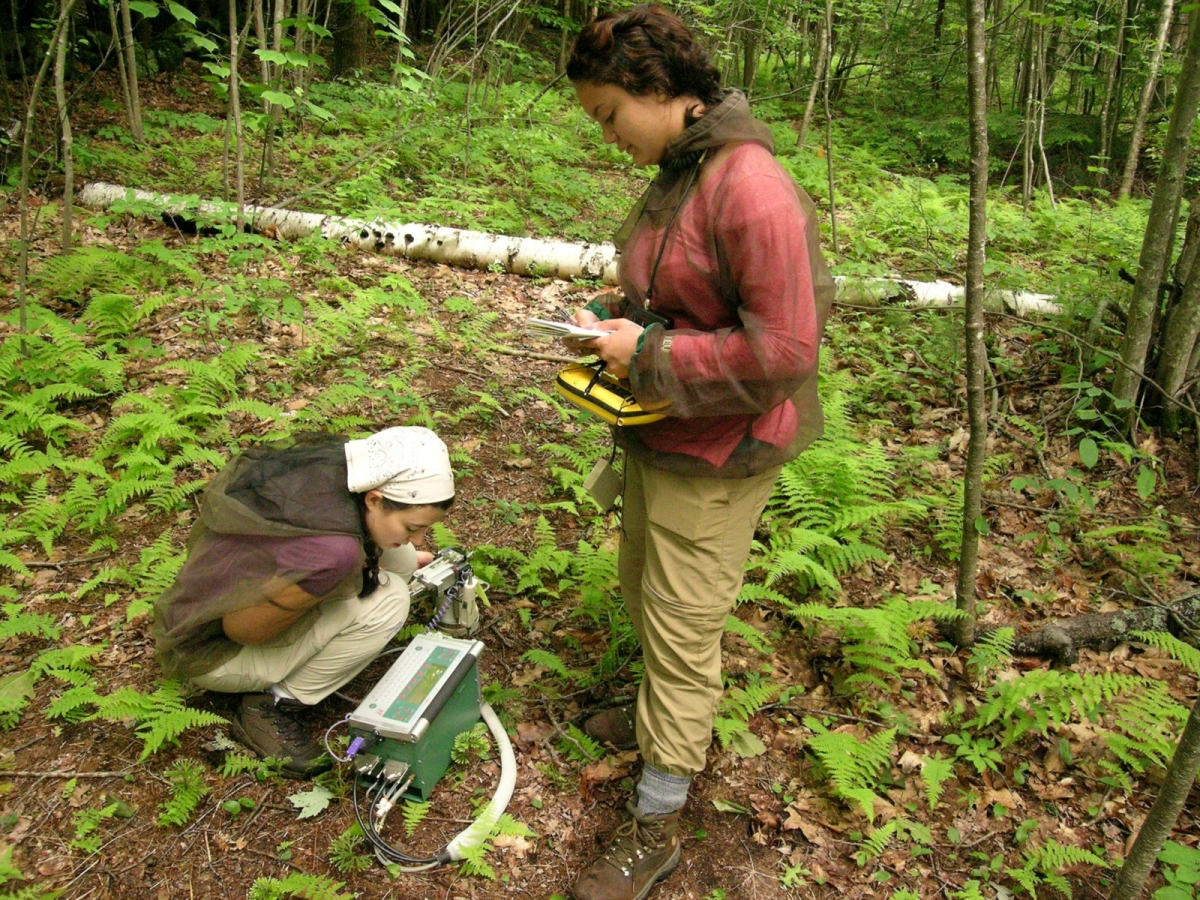
 The collars are where we measure carbon respiration of the soil. Using our lovely Li-Cor, we can get a reading of how much carbon dioxide the soil is emitting. The main two components of soil carbon emissions are microbe and root respiration. Soil is the largest terrestrial carbon sink, but also releases much more carbon into the atmosphere than humans do each year. We are unaware of how this exchange will be affected in a changing climate. The best way to predict the effect of global warming on soil carbon respiration is to gain a better understanding of what factors influence the ability of soil to store and release carbon.
 Our project focuses on determining how soil carbon emissions change with factors like vegetation density, soil type, temperature, etc. Working with help of our mentor, Jim Tang of the Marine Biological Lab and his team Tim Savas, Xi Yang, and Dr. Qian Yu, we each focus on a different aspect of the project. Candice works on characterizing soil respiration over the natural gradient of varying vegetation and soil types throughout the forest while Adalyn focuses on experiments that manipulate factors like temperature to see how they affect soil respiration and Margaret uses GIS software to display the data that we collect in a clear manner.
Candice
“What is the natural gradient?” This was one of the first questions I asked my mentor after listening to him explain what I would specifically be doing as part of the research project this summer. It turns out that the “natural gradient” simply means the differences in the types of vegetation and soil that occur throughout Harvard Forest without any human interference. There are fifty plots on and around Prospect Hill which all vary in the type of dominant vegetation and soil. I am specifically looking at the dominant tree species at each plot and how much moisture the soil retains at each site. 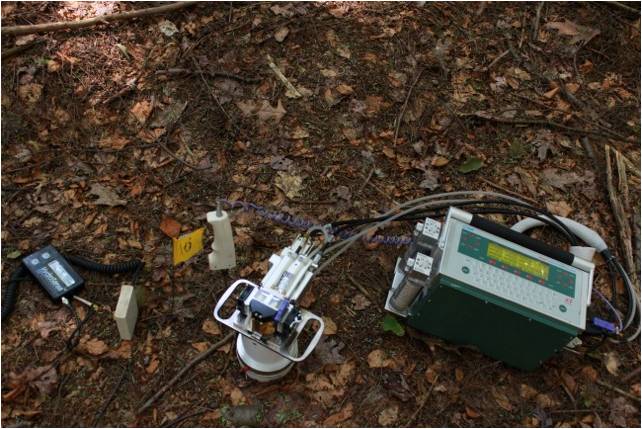
In order to assess which tree species are dominant, we are recording tree species and D.B.H (tree diameter at breast height) of all trees located inside of a 20x20 square meter area around the center of each plot. To determine how well the soil drains, we put a moisture sensor into the ground which gives us the percentage of moisture at each collar. Collecting this information will allow me to determine the patterns of vegetation and soil drainage occurring within the forest.
With the help of my group members, I am measuring the soil carbon efflux from these fifty plots and will later be analyzing the data we collect to see if vegetation and drainage of soil have an effect on respiration. I am very excited to check my observations and ideas about the dominant vegetation at each plot against this data in order to see if I have been observant as I trek through the field every day. I have also become extremely interested in vegetation this past year after taking a trip to Argentina and Chile to study global plant diversity. The segment of the project that I am working fits perfectly with this new found interest, as I am able to hug trees while measuring their diameter.
Adalyn
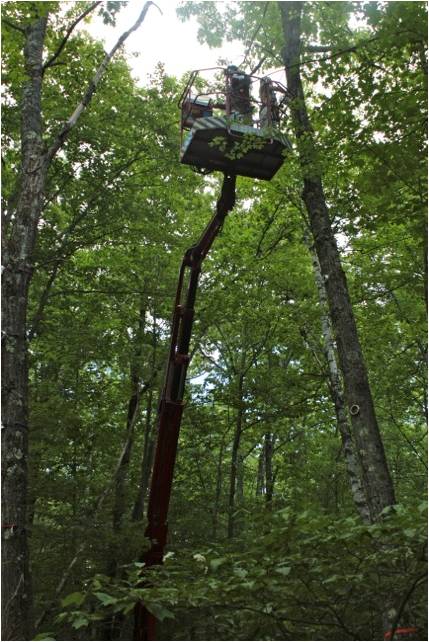
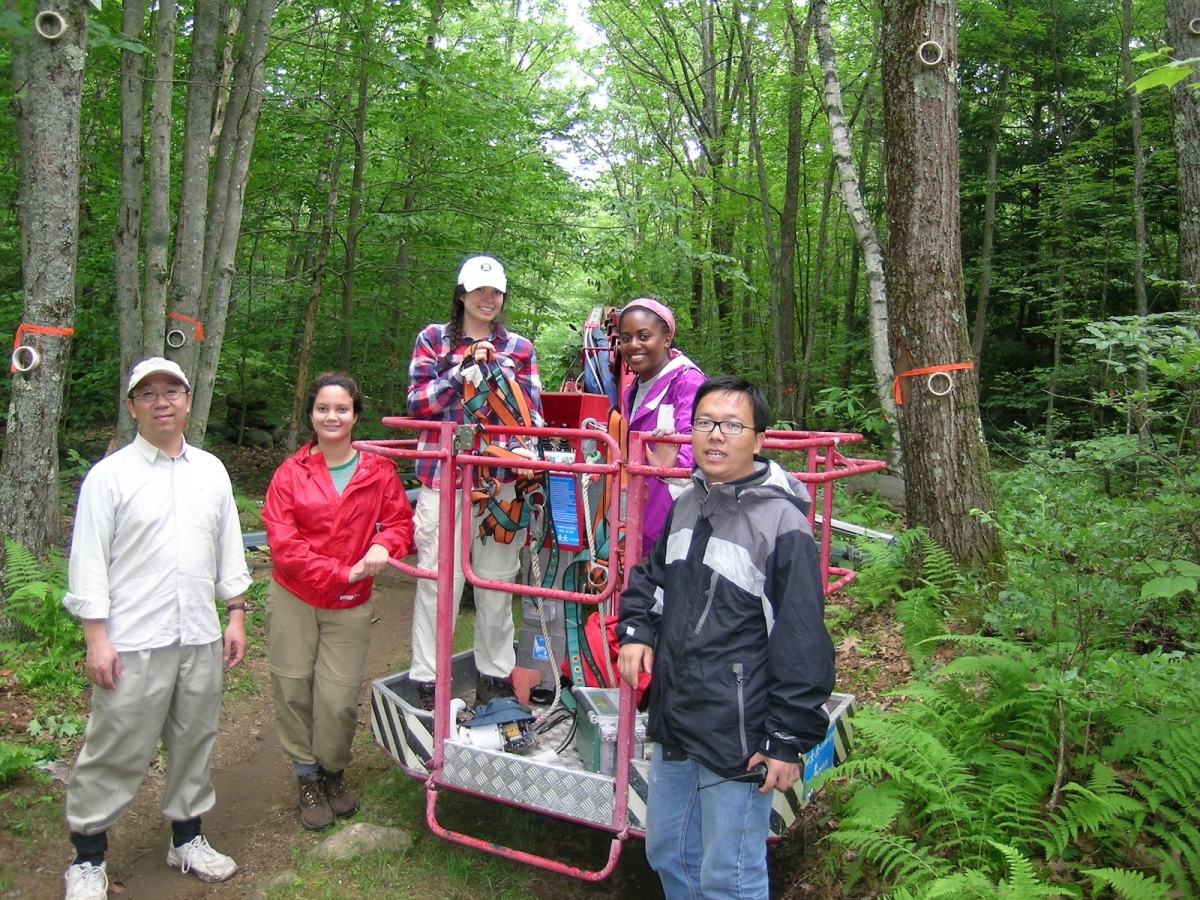
My part of the project focuses on the treatment part of this experiment; that is: if we change the factors that drive how much carbon dioxide soil can store and release, what happens? I have five different treatments: warming, nitrogen addition, root respiration exclusion, leaf litter manipulation, and stem respiration. That last one is to try to get a sense of just how much tree trunks contribute to carbon dioxide emissions—even though plants take in CO2 during photosynthesis, some of this gas is released while the product of the process is being transported through the stem. This is probably my favorite treatment plot because we get to ride Bucky, our handy-dandy cherry picker, way up into the canopy to get measurements from the tops of tree trunks. Here’s a picture of Candice and I up in Bucky taking measurements with Licor!
 The treatment plot I find most interesting? I’d have to say it’s nitrogen addition. I have a passion for all things food, and our agricultural system currently dumps 17 billion tons of nitrogenous fertilizers onto our lands every year. Some research says 20% of nitrogen applied to land is lost through surface runoff or leaching intro groundwater. How is this going to impact the ability of the largest terrestrial carbon sink to store carbon? It might just be one more reason to eat organic!!
Finally, the warming plot is definitely going to show some interesting results in the context of climate change. With anthropogenic emissions of CO2 warming the planet, what effect will that have on soil carbon emissions? If warmer soil releases more CO2, then the atmosphere will have more carbon dioxide, which means a warmer plant, which means warmer soil…that’s a positive feedback loop! Helping to make predictions such as these is exciting. There’s so much we don’t know about how our actions impact the environment, and being a part of the community that helps to characterize these interactions is pretty cool.
That’s pretty much my part of the project. I’m super excited to see the results—Margaret is going to make our data much easier to understand with her mapping skills, so let’s see what she’s been working on!
My specific role in the project is to tie both Candice and Adalyn’s results together. The general goal is to take an average of their measurements and display them on a map. Now, a standard map contains many lines, shapes, and points which symbolize roads, bodies of water, and towns. This type of standard map is used to display the direction of an area. By the end of the program, I will take this simple concept and apply it to our research. In order to do so, I will be using a program called GIS (Geographic Informational Systems) which integrates computer technology and data spatially. Viewing numbers from this perspective will help me find and understand patterns and trends. For this project I will have access to an already existing map of the entire forest. On this map are our plot coordinates with their corresponding numbers, as well as the gate entrances which we use to access each site. In addition, the roads and their subsequent trails can also be viewed.
For each area being studied, I am going to take the average of the total measurements taken per plot and incorporate them into the map. These values will not only represent the carbon dioxide flux from the Li-Cor, but they will also include average temperature (°C) and moisture (%) per plot. An array of colors will be used to provide a range of values per area. The resulting image will allow me to depict trends and patterns that indicate where carbon is being released the most in the entirety of the forest. For example, I will be looking to see if the carbon flux is higher in areas with increased temperature or if it is lower compared to other regions of the land.
This information is important because increase carbon dioxide can cause climate change and alter many species of plants and animals. Also, in relation to the goal of the project, my section will organize the data from Candice and Adalyn in a spatial and visually appealing matter to see just how much the forest is being affected by soil respiration. It has been an honor to be the first student from Villanova University in this program. Working in a group with two very dedicated ladies has been a wonderful experience.