
You are here
Witness Tree Social Media Project
What Is a Witness Tree?
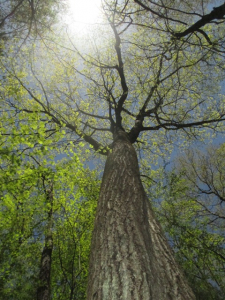
The Harvard Forest Witness Tree, the oldest known living organism on social media, is an ambassador for life in a changing environment.
In 2017, the century-old tree first came into the spotlight as the focus of a popular book about climate change, Witness Tree, written by journalist Lynda Mapes.
Inspired by the book and by colleagues at TreeWatch.net, post-doctoral fellow Tim Rademacher installed sensors and cameras on and around the tree. He linked that sensor information to the rich Harvard Forest data archive, adding 55+ years of climate perspective to the tree's outputs. A custom-built computer program translates sensor information into messages for Facebook and X (formerly Twitter).
With collaboration from Clarisse Hart (Director of Outreach and Education at Harvard Forest) and Taylor Jones (Research Assistant Professor at Boston University), recent years have seen a refinement of sensors and equipment, and new outreach with communities and educators, in preparation to deploy three additional witness trees along an urban-to-rural gradient in Massachusetts.
The Witness Tree social media project carries the Witness Tree book's storytelling mission forward, with the added ability to share information about the tree's life and changing environment in real-time.
Resources
Follow the Harvard Forest Witness Tree Online
X (formerly Twitter): https://twitter.com/awitnesstree
NEW! Explore Classroom Resources Created by Teachers and Students
- 2023 Witness Tree Lesson Plans by Dr. Elisa Margarita, teacher at Brooklyn Technical High School
Resources by Project Leaders
Tree Vital Stats | The Sensors | Our Research | News | Contact & Acknowledgements
Harvard Forest Witness Tree: Vital Stats
- Location: Harvard Forest, Petersham, Massachusetts
Scientific name: Quercus rubra
Common names: Northern Red Oak, Red Oak
Age: roughly 110 years old
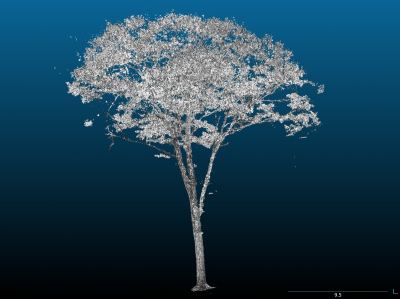
Total above-ground surface area: 437 square meters* - about 1.25 times as big as an IMAX screen!
Tree height: 26.6 meters (87.27 feet)* - 8 stories high
Combined branch length: 2,589 meters (8,494 feet)* - that's 1.6 miles (2.57 kilometers)
Total tree volume: 13.9 cubic meters (492 cubic feet)* - about 1.3 times as big as a concrete mixer truck.
Trunk volume: 5.6 cubic meters (199 cubic feet)* - about half as big as a concrete mixer truck.
Total branch volume: 8.3 cubic meters (294 cubic feet)* - about three-fourths (0.75) as big as a concrete mixer truck.
*LIDAR-derived quantities from scan by Peter Boucher of the Schaaf Lab at the University of Massachusetts Boston, using a LEICA BLK360 on July 27, 2018. LIDAR scan image shown above/left.
The Tree's History, As Seen in Its Rings
What can we learn from tree rings?
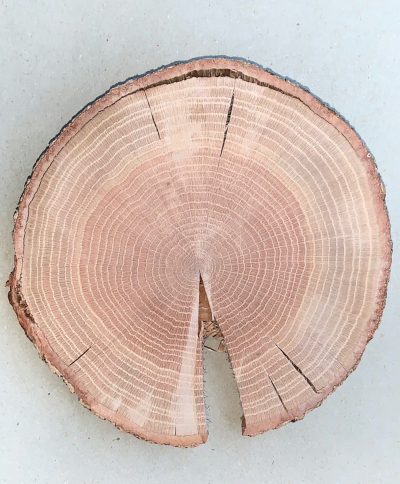
Trees form new rings as they grow during the growing season (in the Northeast U.S., that's May to October). In our region, each ring usually represents one year of growth. Ring formation is sensitive to the growing conditions of the tree and can be impacted by many factors, including temperature, rainfall, and light availability. Varying thickness and color in each ring can reveal what conditions were like in each year of the tree's life.
 What is a tree core?
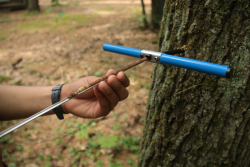
A tree core is collected using an increment borer, which extracts a narrow, dowel-like core from a living tree. The growth rings revealed in the core can be analyzed in the lab (check out the work of the Harvard Forest Tree Ring Lab).
Harvard Forest scientists collected a tree core from the Witness Tree in 2015. The rings reveal that the tree has grown steadily throughout much of its life, despite major disturbances that affected other parts of the forest.
![]()
- 1938: Although 70 percent of the trees at Harvard Forest blew down in the Great Hurricane of 1938, the hurricane did not affect the Witness Tree's radial growth.
- 1945: Widespread spongy moth defoliation in the region can be see in the Witness Tree's rings: the tree's growth was low that year.
- 1962: A major ice storm that impacted much of the region did not affect radial growth of Witness Tree.
- 1981: Widespread spongy moth defoliation in the region can be seen in the Witness Tree's rings: the tree's growth was low that year.
Sensors
Harvard Forest scientists installed the first sensors on the Witness Tree in 2018.
In 2021, Taylor Jones from Boston University developed and deployed a new kit with updated sensors. More on that coming soon!
 Dendrometer
What the sensor measures:
The growth of the tree in real time, by tracking changes in the trunk's radius, including swelling and shrinkage of the trunk on daily time cycles and expansion of the tree's radial growth over the course of the growing season.
Why this sensor?
There are two types of dendrometers commonly used to measure growth in trees: a band dendrometer that wraps around the entire trunk to measure changes in circumference, and a point dendrometer that measures radial growth at a single point on the tree. The Harvard Forest Witness Tree uses a point dendrometer, which gives very precise information in real time. Many other long-term studies at Harvard Forest use band dendrometers, which are less precise day to day, and are more appropriate for forest studies involving many trees and longer time-scales.
How the sensor works:
Inside the dendrometer is a spring-loaded metal rod and a resistor. The spring ensures the metal rod is always pushing out towards the tree trunk. An electrical excitation of known voltage is sent through the resistor. Any change in circumference of the trunk causes the rod to be pushed in or out, which changes the length of the resistor through which the electricity flows, and therefore affects the returned voltage. The measured voltage difference can then be translated into a radial distance (growth measurement).
Why it's important:
Tree growth is surprisingly complex. A tree's circumference grows and shrinks even in the course of one day, depending on water availability. As the tree grows over the course of the growing season (May to October), its trunk is thickening, cell by cell. The carbon stored in those cells helps to offset carbon dioxide in the atmosphere. A dendrometer provides long-term data about tree growth and ultimately, helps us understand carbon storage and an individual tree's role in helping to combat climate change.
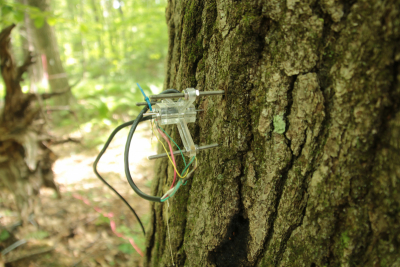
 Sap-flow Sensor
What is sap flow?
Sap is a water-like substance containing nutrients and hormones that moves throughout the roots, stems, and branches of a tree. Its flow can vary depending on temperature, water availability, the tree's photosynthetic rates, and other environmental and physiological factors.
What the sensor measures:
- Sap flow/movement within the xylem vascular system
- Total tree water use
- Tree transpiration
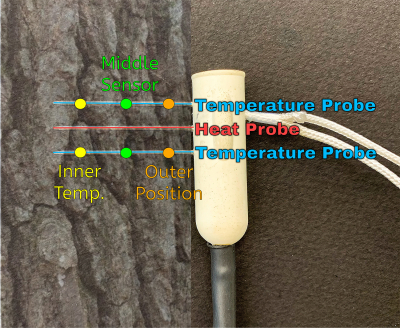
How the sensor works:
Three probes are installed inside the bark of the tree, embedded into the tree's sap transport network. The middle probe produces a heat pluse and the two outer probes (upstream and downstream) are equidistant from the heat probe. The sensor measures the amount of time it takes for the heated sap to reach an outer probe. See Jones et al. 2020.
Why it's important:
Sap-flow sensors help scientists understand how climate (particularly extreme events such as heatwaves and drought) affect a tree's water use and nutrient transport.
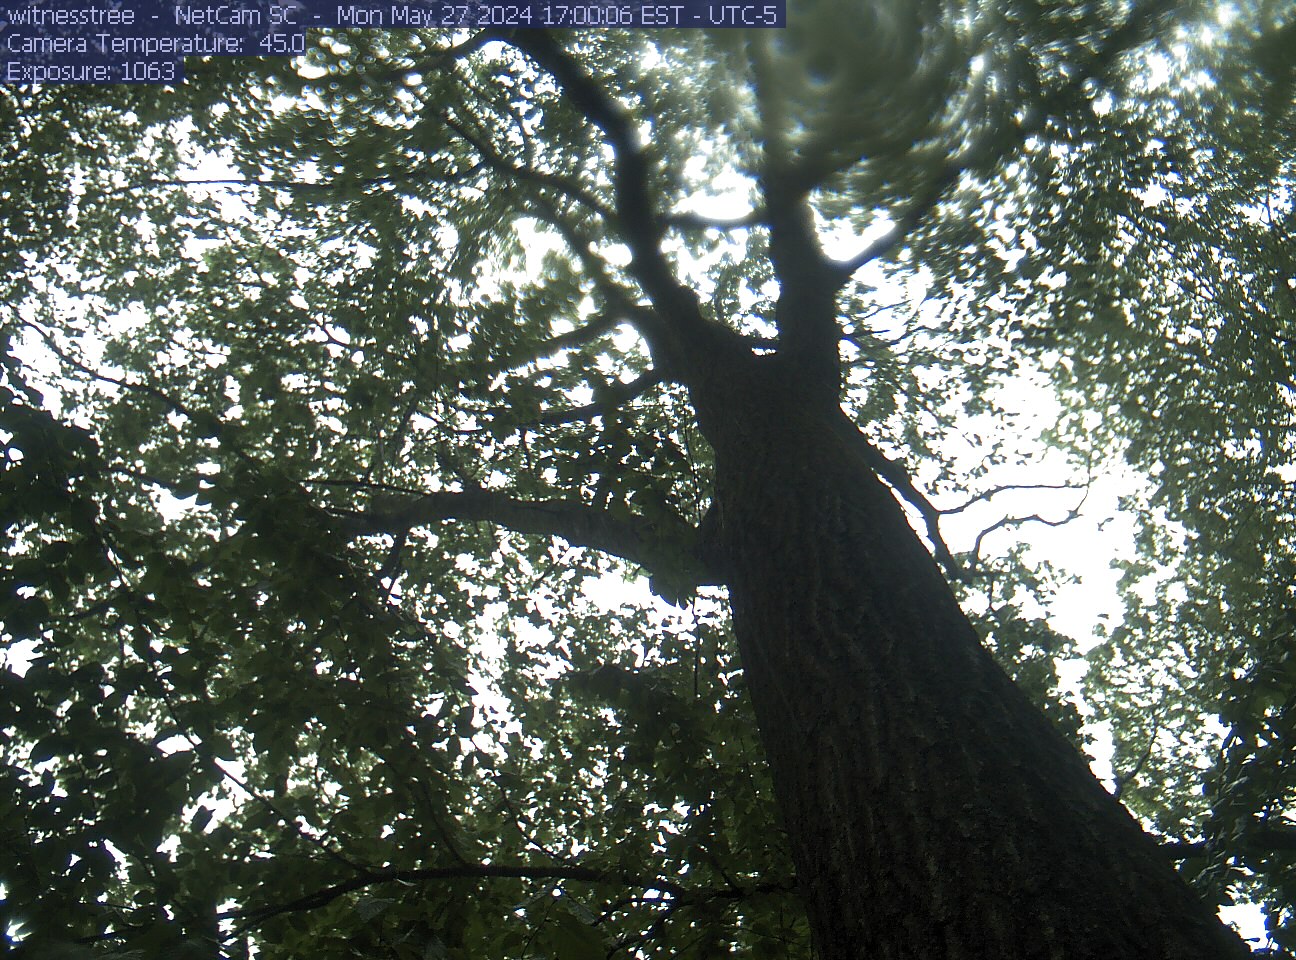 PhenoCams
What is a PhenoCam?
A digital camera set up in a fixed location to measure seasonal change in plants over time. The PhenoCam network now has cameras all over the world. There are 13 at the Harvard Forest alone.
What the sensor measures:
- The growth and dropping of leaves, as influenced by seasonal and climatic changes.
- The change in color, primarily greenness (a measure of photosynthetic activity) in the canopy over time.
How the sensor works:
A PhenoCam takes photos throughout the year – at 30-minute intervals – that can be viewed independently, made into a time-lapse to capture the events of the growing season, and compared to other trees in the network. The PhenoCam image of the Harvard Forest Witness Tree (at left) is a live feed!
Environmental Data
The combined Shaler Meteorological Station at Harvard Forest (no longer in commission) and the Fisher Meteorological Station (which replaced the Shaler station in 2001) has collected weather data from 1964 to the present. The Fisher Meteorological Station measures weather data every 15 minutes. Our Witness Tree is one of many research studies using these data as environmental context.
What the sensors measure:
Soil temperature
Air temperature
Relative humidity
Dew point
Precipitation
Solar radiation
Photosynthetically active radiation
Wind speed
Wind direction
Net radiation
Gust speed
Light Detection and Ranging (LIDAR) Point Cloud
What is LIDAR?
A device that consists of a laser, a scanner, and a GPS receiver, used to make three-dimensional images.
What it measures:
A variety of attributes for an object, and has been used for geographical mapping, atmospheric mapping, forestry, graphics, and land-use planning. At Harvard Forest, it has been used under the canopy to quantify the volume and condition of leaves and wood in a forest stand.
How our scan came to be:
We are grateful to Crystal Schaaf, Professor, and Peter Boucher, PhD student, both at University of Massachusetts Boston's School for the Environment, who created the LIDAR scans of the tree for our project. Learn more about their lab!
How it works:
A laser with a certain wavelength is beamed over the object and is reflected back. The amount of time it takes to reflect back and the speed of light is used to calculate the distance of the object with the following equation: Distance of the object = (Speed of Light x Time of Flight) / 2
Our Research
In addition to Tim Rademacher and Taylor Jones's research, which employs sensor data from the growing Witness Tree network, we are also studying how social media users engage with the tree online. In particular, we're asking:
- Do data-driven or narrative communication approaches differentially drive public engagement with the tree's messages on social media?
- Does the addition of multimedia (images, videos, data visualization) enhance engagement with the tree's messages on social media?
- What are the environmental learning outcomes of this novel science communication platform?
Project News
- The Harvard Crimson (October 2022): Bearing Witness to Climate Change
- CBS Boston (September 2022): A Massachusetts Tree Is Live-Tweeting Climate Change
- National Association for Interpretation (April 2022): Video podcast and keynote presentation about the Witness Tree project
- Falling Walls Science Engagement Award winner: Tim Rademacher (2022): Scientist Highlight and Video
- The Conversation (October 2021): To Save Forests, Researchers are Hooking Up Trees to Twitter
- Internet of Nature podcast (September 2021): Tim Rademacher on Creating the Tree That Is Live-Tweeting Climate Change
- Teacher Workshop (August 2021): Trees Telling STEM Stories
- Harvard Gazette (July 2020): Climate Change Solutions Fund grants bet on new ideas for the next generation
- KNAU Earth Notes (May 2020): The Witness Tree
- The Weather Channel (April 2020): The Tree Tweeting about Climate Change
- WCVB Boston's Chronicle (October 2019): Twitter Is for the Trees
- Boston25 News (September 2019): How a Tree in Central Mass. Is Using Twitter to Share Climate Data
- Boston Globe (August 2019): Self-Tweeting Tree is Harvard's Newest Climate Change Educator
- KUOW Radio (August 2019): What We Can Learn from a Nonagenarian Oak Tree
- TV: Worcester News Tonight (August 2019): Witness Tree Tweets
- NPR's All Things Considered (August 2019): This Red Oak Tree Has Its Own Twitter and It Shares Insight About Climate Change
- Weather.com (August 2019): Tweeting Tree Bears Witness to Climate Change
- Harvard Gazette (August 2019): A Red Oak Live Tweets Climate Change
- Mental Floss (July 2019): A Massachusetts Tree Is Live-Tweeting Its Perspective on Climate Change
- Atlas Obscura (July 2019): The Tree That Is Live-Tweeting Climate Change
An Important Note about Visiting This Tree
The Harvard Forest Witness Tree was chosen for this project specifically because it is not unusual. It is one of thousands of similarly picturesque, interesting, and ecologically valuable red oak trees at Harvard Forest. We ask that you do not seek to find and visit the tree for two reasons: 1) it is purposefully located off the beaten track, in a research area that is filled with wires and delicate equipment that can be easily tripped over and dislodged, disrupting the important work underway, and 2) foot traffic is hard on forests. Trampling the plants in the pathway near and around the tree also disrupts our research.
We ask that if you visit the Harvard Forest, you stick to designated trails, and marvel at the incredible, 100+ year-old oak trees that surround you there.
Project Contacts
We welcome your feedback and questions!
Tim Rademacher, Post-Doctoral Fellow, Harvard Forest, Université du Québec en Outaouais (Project Science Lead)
Taylor Jones, Research Assistant Professor, Boston University (Project Engineering Lead)
Clarisse Hart, Director of Outreach & Education, Harvard Forest (Project Outreach Lead)
hart3@fas.harvard.edu; (978) 756-6157
Acknowledgements
This project would not be possible without generous funding from the National Science Foundation (DEB-1741585 and DBI-1459519 REU Site) and intellectual contributions by many colleagues.
- Lynda V. Mapes, dedicated Harvard Forest scholar, champion of this project, and author of Witness Tree: Seasons of Change with a Century-Old Oak.
- Tina Grotzer, faculty member and researcher at the Harvard Graduate School of Education, whose guidance and insights continue to improve the project's reach and impact.
- Flossie Chua, a PI at Project Zero, who is leading a study on the impacts of this project on climate change teaching in the high school classroom.
- Kyle Wyche, 2018 Harvard Forest summer research program (REU) student, who wrote the foundational messages for the project.
- Shawna Greyeyes, 2019 Harvard Forest summer research program (REU) student and 2019-2020 ESA SEEDS SPUR Fellow, who developed the Witness Tree website, created messages for the project, conducted a scientific analysis of outreach impact, and created the Witness Tree Facebook page.
- David Jonas Basler, a postdoctoral fellow at Harvard forest, who contributed to sensor-based work for the project.
- Elisa Margarita, STEM education leader and science teacher at Brooklyn Technical High School, who worked in 2022 and 2023 to create shareable lesson plans for the project.
- Aika Yamamoto, a Harvard Graduate School of Education alum who worked with us as an instructional design specialist in 2023 to build lesson plans for the project.
- Yiou Wang, a Harvard Graduate School of Design alum who worked with us as a data visualization specialist in 2023 to build a new web-tool for the project.
- Mark VanScoy, Harvard Forest Research Assistant, for technical assistance with the cameras and sensors.
- Alexa Rice, Harvard Divinity School graduate student, who helped shape the social media presence for the tree.
- Aaron Ellison, Harvard Forest Senior Ecologist and Deputy Director, who continues to provide input and amplification for the project.
- Emery Boose, Harvard Forest Information Manager, for technical assistance with the website, and for developing the Forest's wireless network, which makes this project possible.
- Andrew D. Richardson from Northern Arizona University, the Principal Investigator (PI) for the grant funding this project, and an important contributor to the project's foundational concepts.
- David Orwig, Forest Ecologist at Harvard Forest, who cored the Witness Tree and has given important insight into its history.
- Bijan Seyednasrollah, post-doctoral fellow at Harvard University and Northern Arizona University, who helped with the code and hardware to automate the posting of phenological observations.
- Kate Petersen, coordinator of the Center for Ecosystem Science and Society at Northern Arizona University, who contributed outreach ideas to the project and manages publicity from NAU.
- Crystal Schaaf, Professor, and Peter Boucher, PhD student, both at the University of Massachusetts Boston School for the Environment, who generously contribute LIDAR scans of the tree for the project.
- Hannah Robbins, Harvard Forest Conservation Communication Manager, who gave important insights into our work with social media.
- TreeWatch.net, which inspired our path to this tweeting tree.
- The dozens of interested scientists, students, educators, writers, and social media users who have contributed feedback and suggestions for the project.
