
You are here
Climate change impacts on phenology and ecosystem processes of northeastern forests
Phenology is the study of changes in organisms due to the seasonal cycle. Phenological shifts in forest and other ecosystems, due to climate change, could have important impacts on carbon and nutrient cycling. Therefore, it is important to find easy and accurate ways of tracking phenology in numerous ecosystems over an extended period of time. The Harvard Forest has multiple digital cameras set up to take photos of the canopy. These cameras are part of a larger network of digital cameras known as the Phenocam network. Images from this network are used to evaluate changes in phenology based on how green the canopy is. Our research team has spent the summer evaluating different methods for tracking phenological changes.

Lakeitha, Rachel and Isaac spend most of their time working on data analysis. The task began with the data management of 400 GB of phenocam data from 130 sites across the country. The images were filtered, organized and data was collected on each site. Next the data was analyzed to create a time series for each year of data. The phenological models were then checked against visual inspection to see if they hold up for different ecosystems. Lastly, the webcam data was compared to the MODIS satellite data, to determine the strengths and weaknesses of the Phenocam network.
 Libby’s project aims to test various methods for calculating Leaf Area Index and trackingthe changes in photosynthetic capability of the trees over the course of the season. She is primarily investigating the use of photography to study this. Previous research has shown that LAI can be calculated by taking upwards looking photographs of tree canopies using a fisheye lens and correcting for leaf angle based on the theory that when combined, the angles of the leaves will roughly correlate to a full sphere. This method also only allowed for photographs to be taken in certain light conditions, so usually at dawn or dusk. This summer Libby is trialling a less restrictive sampling procedure using digital cover photography. Once a week she goes out to 33 plots in the footprint of the EMS tower and takes 3 images of the canopy. These photographs are in RAW format so that exposure can be manipulated later on the computer. These files are then analyzed to calculate LAI. Libby also takes horizontal photographs of the leaves of three tree species- yellow birch, red oak and red maple- from the walk up tower to derive leaf inclination angle distribution functions which can be used in conjunction with the canopy photos to derive a more accurate estimation of LAI. This data set is then compared with LAI-2000 measurements and canopy greenness from the EMS tower webcam image archives.
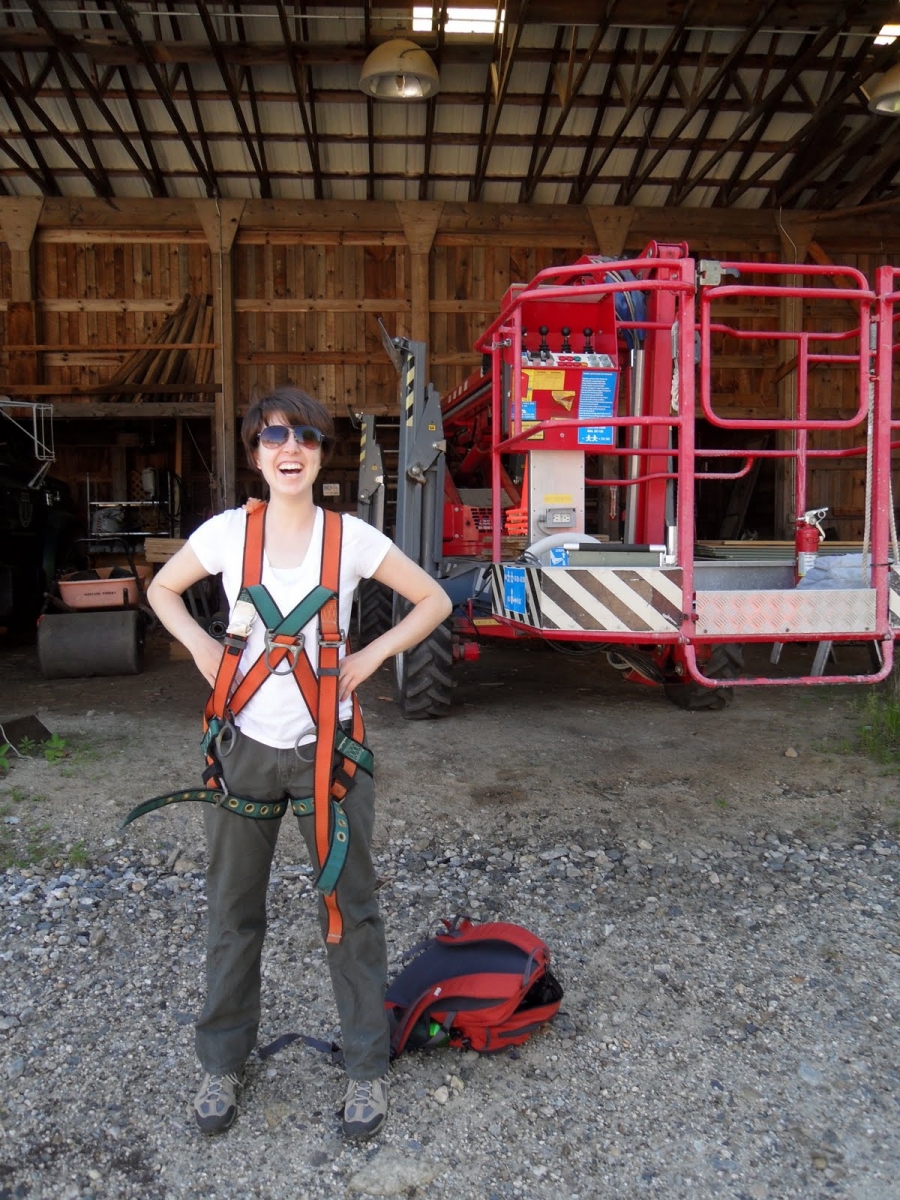 Bridget has spent her summer taking leaf level measurements to use in later parameter derivation for phenological models and to compare the seasonal trends in leaf physiology with the Phenocam images. The goal is to understand how physiological changes within the leaf correlate to the changes in greenness we are seeing with the Phenocam data. She samples leaves from the canopy walk-up tower and then measures the leaf spectral properties, fluorescence, leaf area and mass in order to track changes of the properties over time. She also spends a lot of time up in the canopy sitting in Bucky, the forest cherry picker, taking gas exchange measurements in order to understand the how photosynthetic rates of different tree species vary throughout the season.
