
You are here
Some Genes Like It Hot
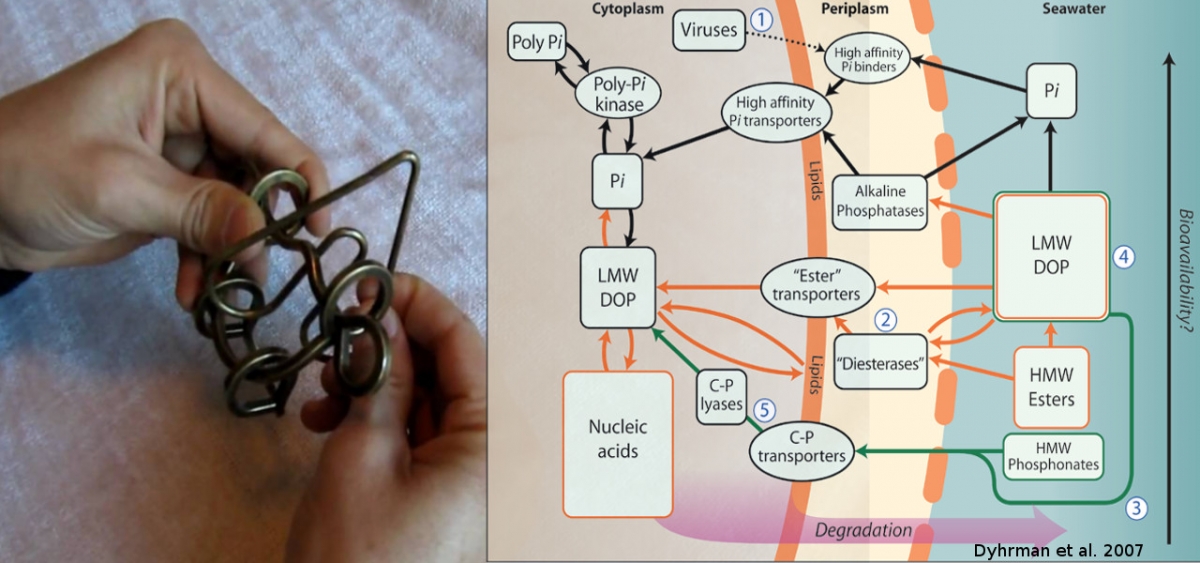 Biology is a 3D puzzle; an infinitely large logic game with the universe, made up of numerous rings, bars, and strings inexplicably intertwined. A scientist attempts to make sense of these knots, looking for patterns in the pathways. This summer, I have been trying to trace these connections in strings of DNA in hopes of uncovering the story of soil life after decades of experimentally-induced warming.
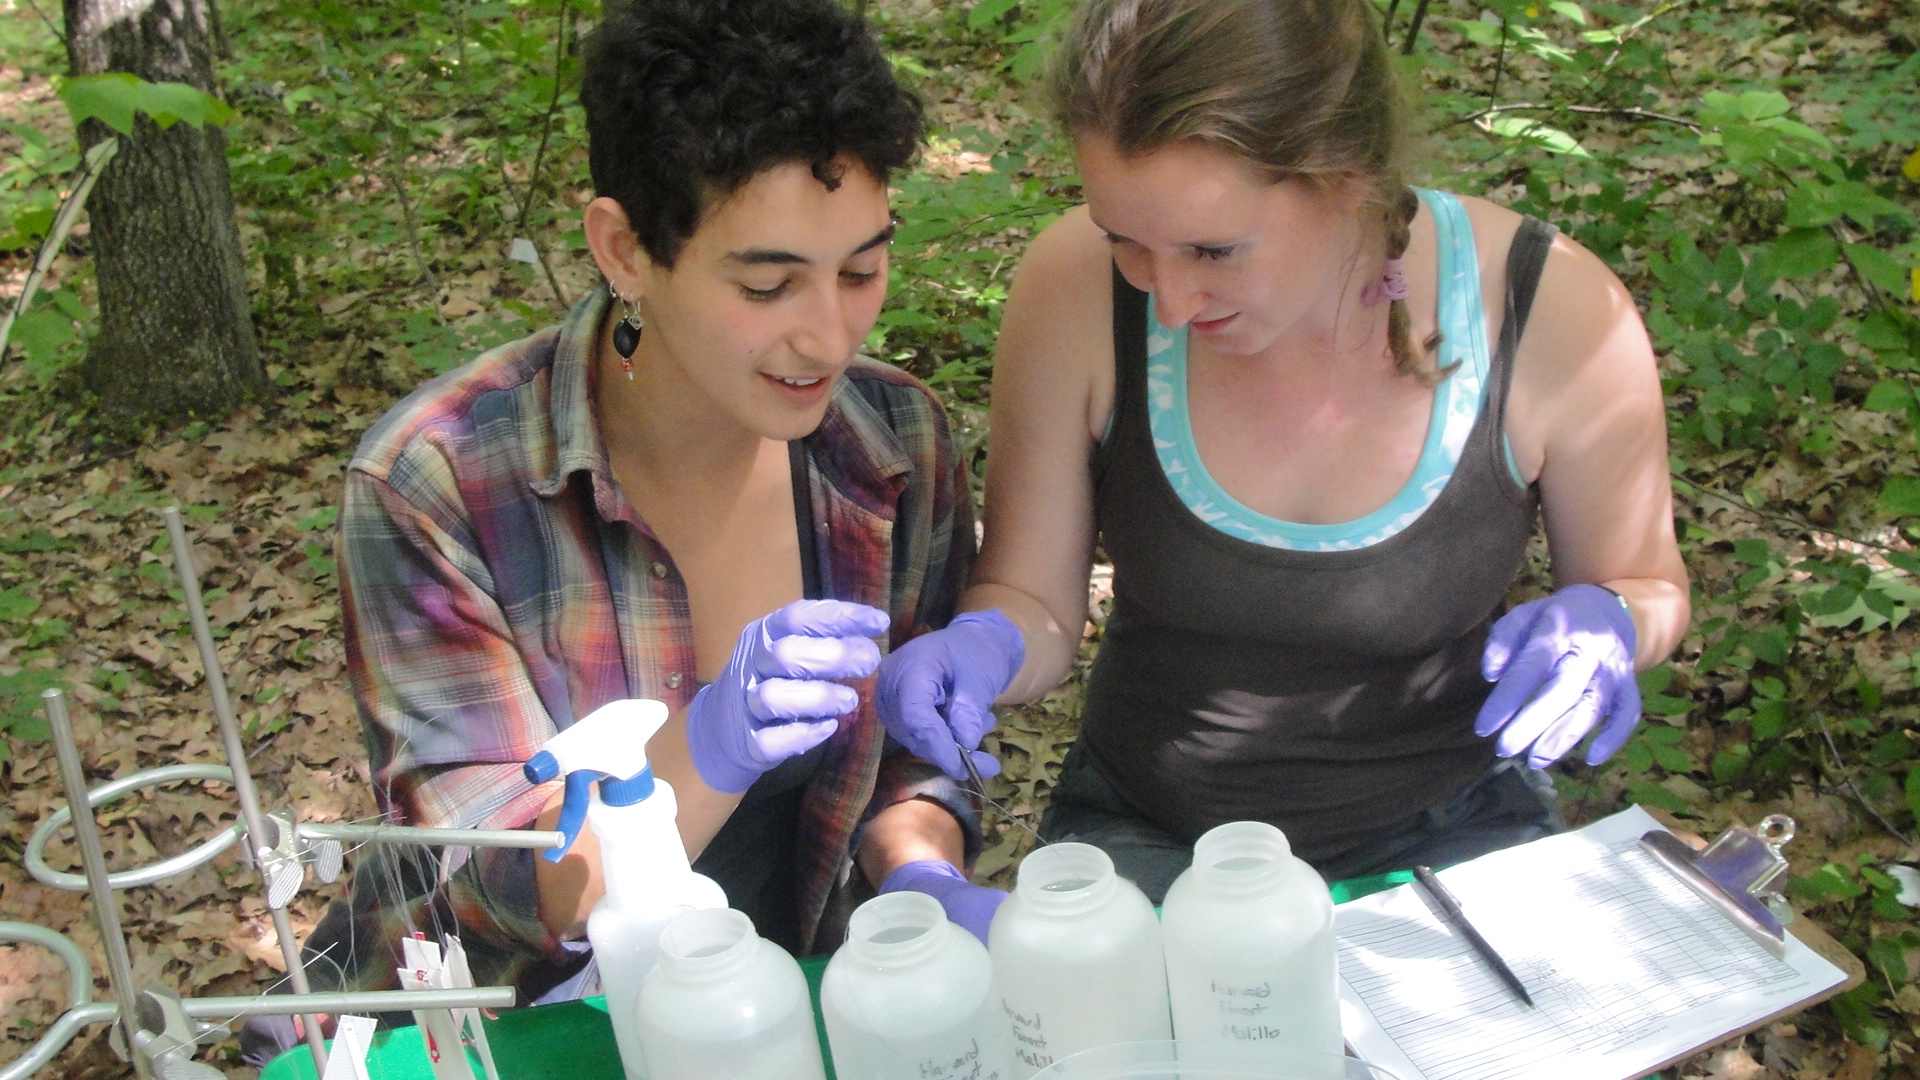
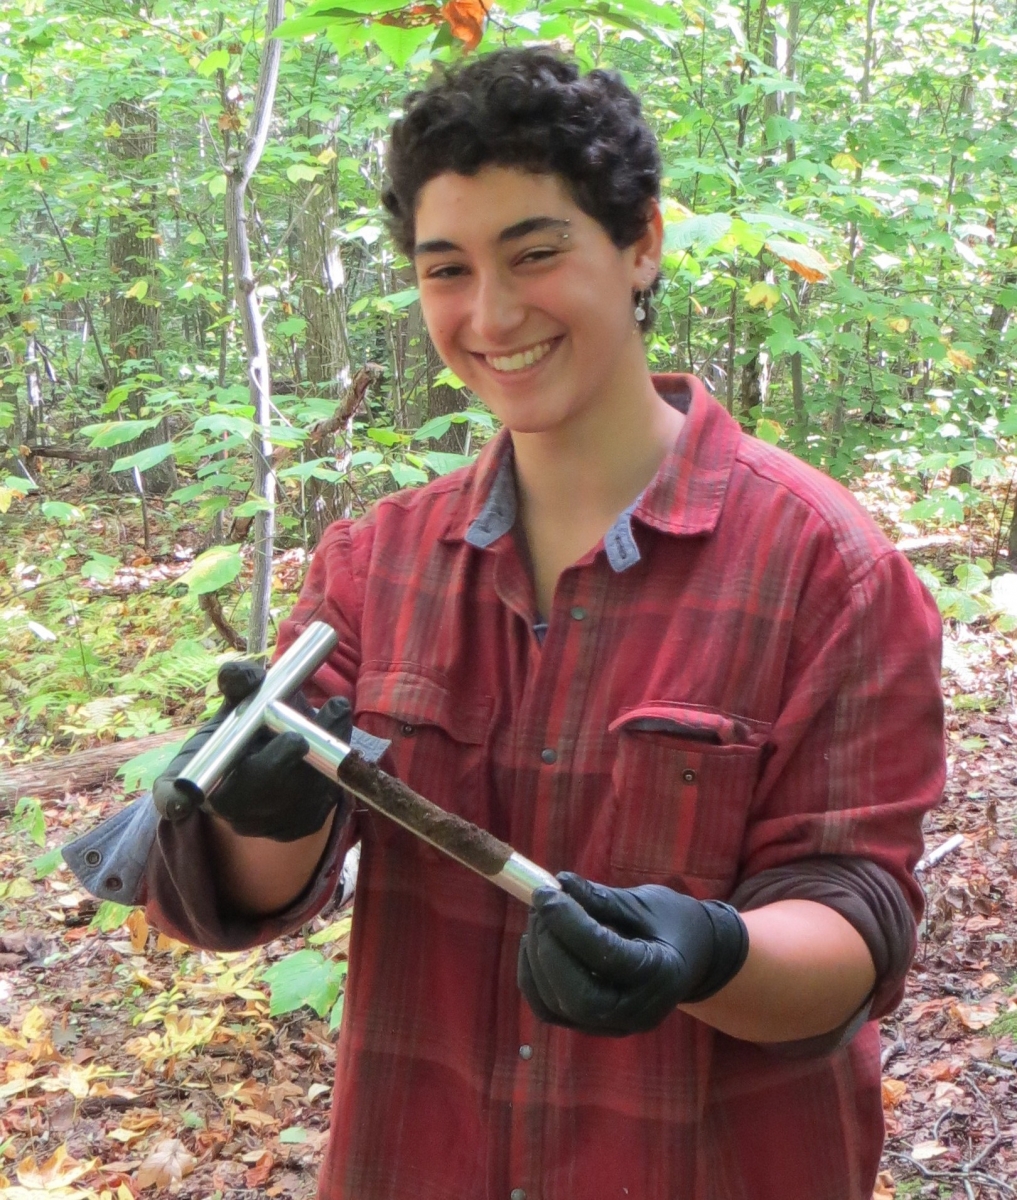
In October of 2011, soil cores were taken from each of the three soil warming experiments at the Harvard Forest and immediately immersed in a bath of ethanol and dry ice. This precious, mad-scientist looking concoction was carefully transported back to UMass Amherst, where a team led by Jeffrey Blanchard and Kristen DeAngelis spent the next year extracting DNA and RNA. These samples were sent off to be sequenced, which eventually returned as a truly enormous data files containing genomic information for all of the organisms abundant in the soils. The next step? Data analysis.
 Under the mentorship of Jeff’s graduate students, Lauren Alteio and William Rodriguez, I have spent this summer learning how to write code in the statistical programming language R to give meaning to a whole bunch of A’s, T’s, G’s, and C’s. The goal is to put that meaning into the context of ecological nutrient cycling in forest soils.
In the past twenty-odd years, Jerry Melillo and crew have carefully measured carbon cycling through respiration levels and biomass calculations, nitrogen mineralization in soil and concentrations in plant tissues, and a whole slew of other community traits like tree species, soil pH, and soil moisture. All of this work led to a powerful hypothesis: warming increases the rate of organic matter decomposition in the soil, releasing a huge amount of nitrogen and causing a dramatic increase in plant growth.
After ten or so years of this, however, everything slowed down. But why? Something else began to limit growth, and the best hypothesis was phosphorus. This new idea called for a whole new set of chemical measurements, which are being taken by Alana this summer (read about it here!).
As it turns out, phosphorus is an indispensable nutrient for life. Phosphorus is one of the three primary nutrients in soil, is found in molecules that create the protective phospholipid bilayer that surrounds cells, and is a main component of DNA, RNA, and adenosine triphosphate, commonly known as an “energy storing molecule”. So if phosphorus is involved in all of these important processes, what has changed with warming to cause it to become a limiting nutrient? That’s where all of the genomic information comes in. RNA is created when cells are actively completing biological processes, so looking at what functions the RNA can be linked to is a pretty good proxy for what the cells are doing in the soil.
Using databases to map our sequences to organisms and biological processes, I have been trying to understand how an increase in one phosphate gene may or may not point to a changing nutrient cycle. On the one hand, it feels like a lot of guesswork. However, when a new R script helps to visualize the changes in gene abundance across all of the samples, trends do indeed pop out. It takes some work to find them, but I am constantly astounded by the stories that these puzzles are able to tell me.
